![]()
![]()
![]()
Next: S(m) graph Up: Performance modelling Previous: C/A and S/A ratio display field
T(V) graph
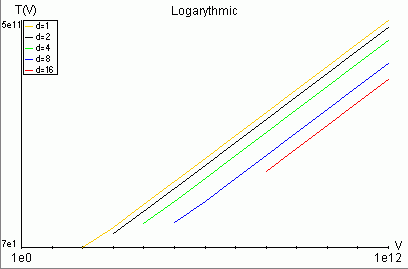
This graph shows the relationship between the entire calculation time Cmax (including communications and computations) and size of problem V. Schedule length Cmax is denoted T(V) in this graph. The shape of displayed curves depends on the selected architecture and C/A and S/A values.
T(V) graph can be displayed in two scales: linear and logarithmic. You can change it by clicking on the graph area. The current status of the display is shown at the top of graph.
Minimum and maximum values of calculation time are shown at T(V) axis (rounded to one digit).
For every architecture no more than five curves with a legend (top of graph) are displayed. These curves indicate dependence of schedule length vs. V.
Note that a feasible solution (i.e. with ![]() >0) can be found only for
certain m and V for the given C/A, S/A. Points for which a
feasible solution does not exist are not shown in the graph. Therefore, not
every curve starts at V=1e0.
>0) can be found only for
certain m and V for the given C/A, S/A. Points for which a
feasible solution does not exist are not shown in the graph. Therefore, not
every curve starts at V=1e0.