What makes multi-class imbalanced problems difficult? An experimental study.
Mateusz Lango, Jerzy Stefanowski
1 Impact of class overlapping and imbalanced ratio on the classifiers performance
1.1 Decision Tree, datasets with 3 classes
Class recalls (odd rows) and OC Ratio (even rows) for the triangle datasets with imbalanced ratios (columns) from 1 to 20 versus class overlapping measured by standard deviation. Class 1 is the majority class whereas classes 2 and 3 are minority classes (except the balanced dataset were all classes have the same size).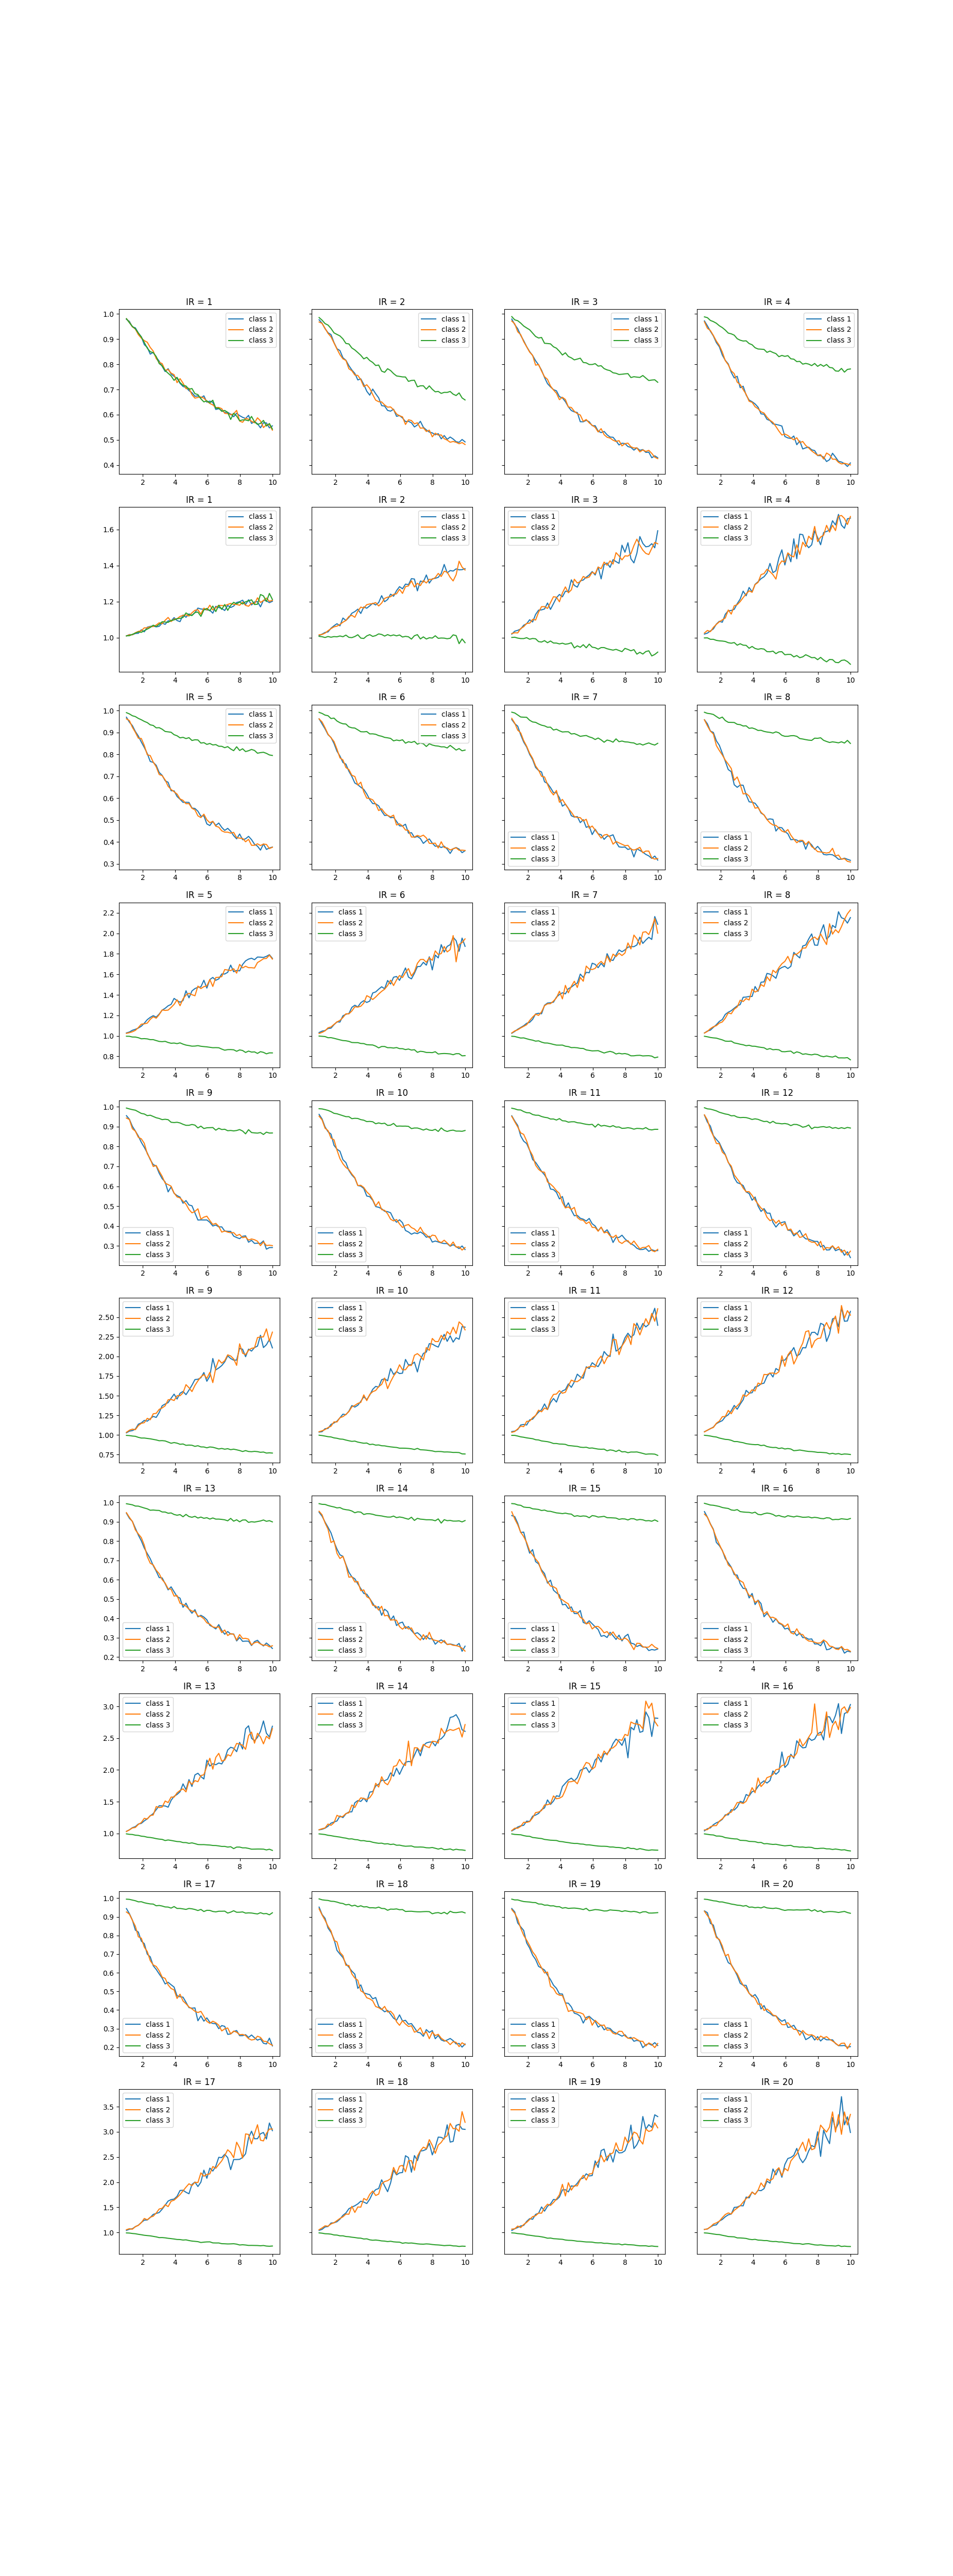
1.2 K-nearest neighbors, datasets with 3 classes
Class recalls (odd rows) and OC Ratio (even rows) for the triangle datasets with imbalanced ratios (columns) from 1 to 20 versus class overlapping measured by standard deviation. Class 1 is the majority class whereas classes 2 and 3 are minority classes (except the balanced dataset were all classes have the same size).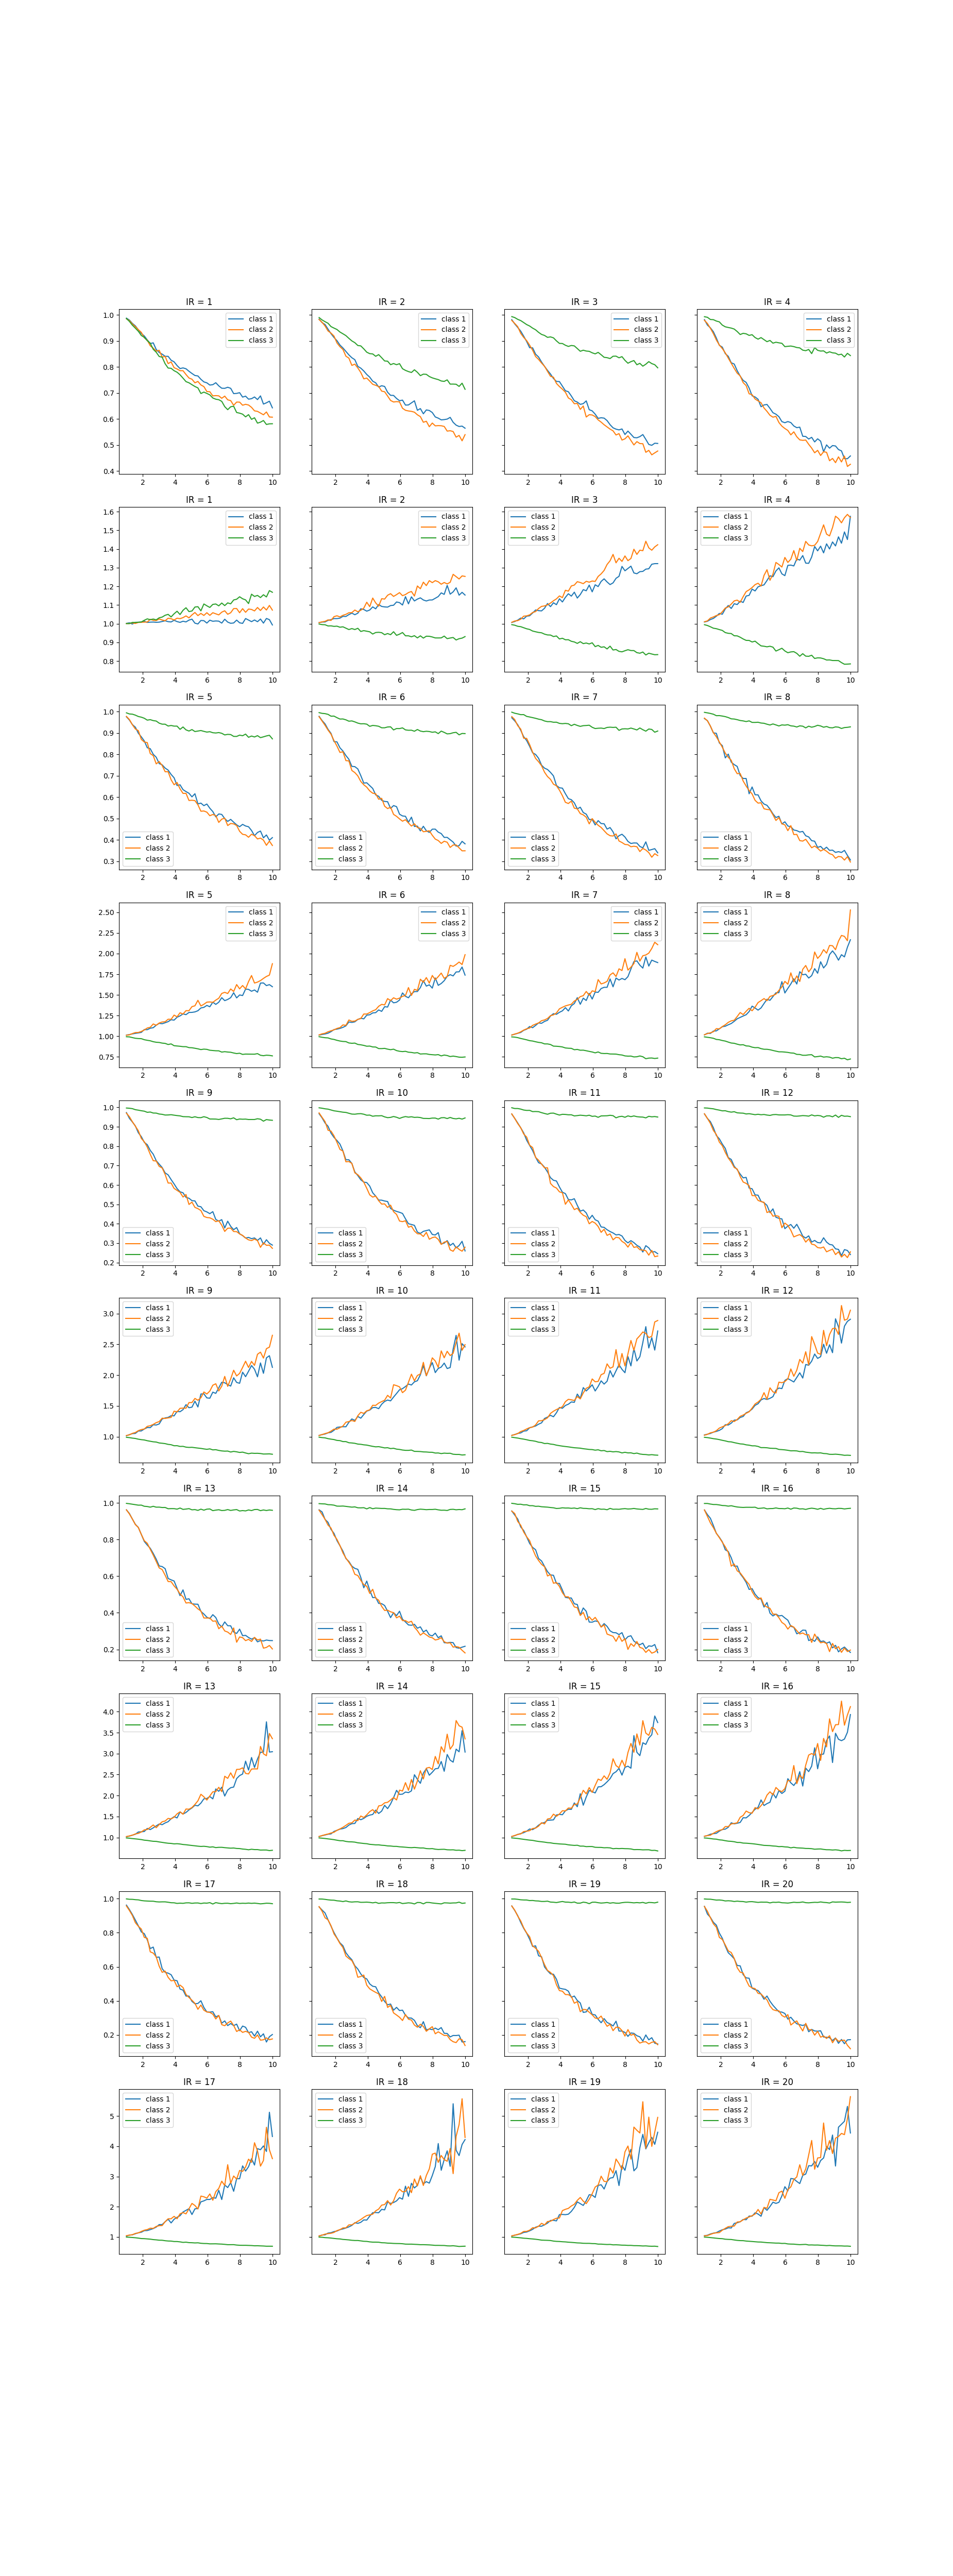
1.3 Bagging with 30 decision trees, datasets with 3 classes
Class recalls (odd rows) and OC Ratio (even rows) for the triangle datasets with imbalanced ratios (columns) from 1 to 20 versus class overlapping measured by standard deviation. Class 1 is the majority class whereas classes 2 and 3 are minority classes (except the balanced dataset were all classes have the same size).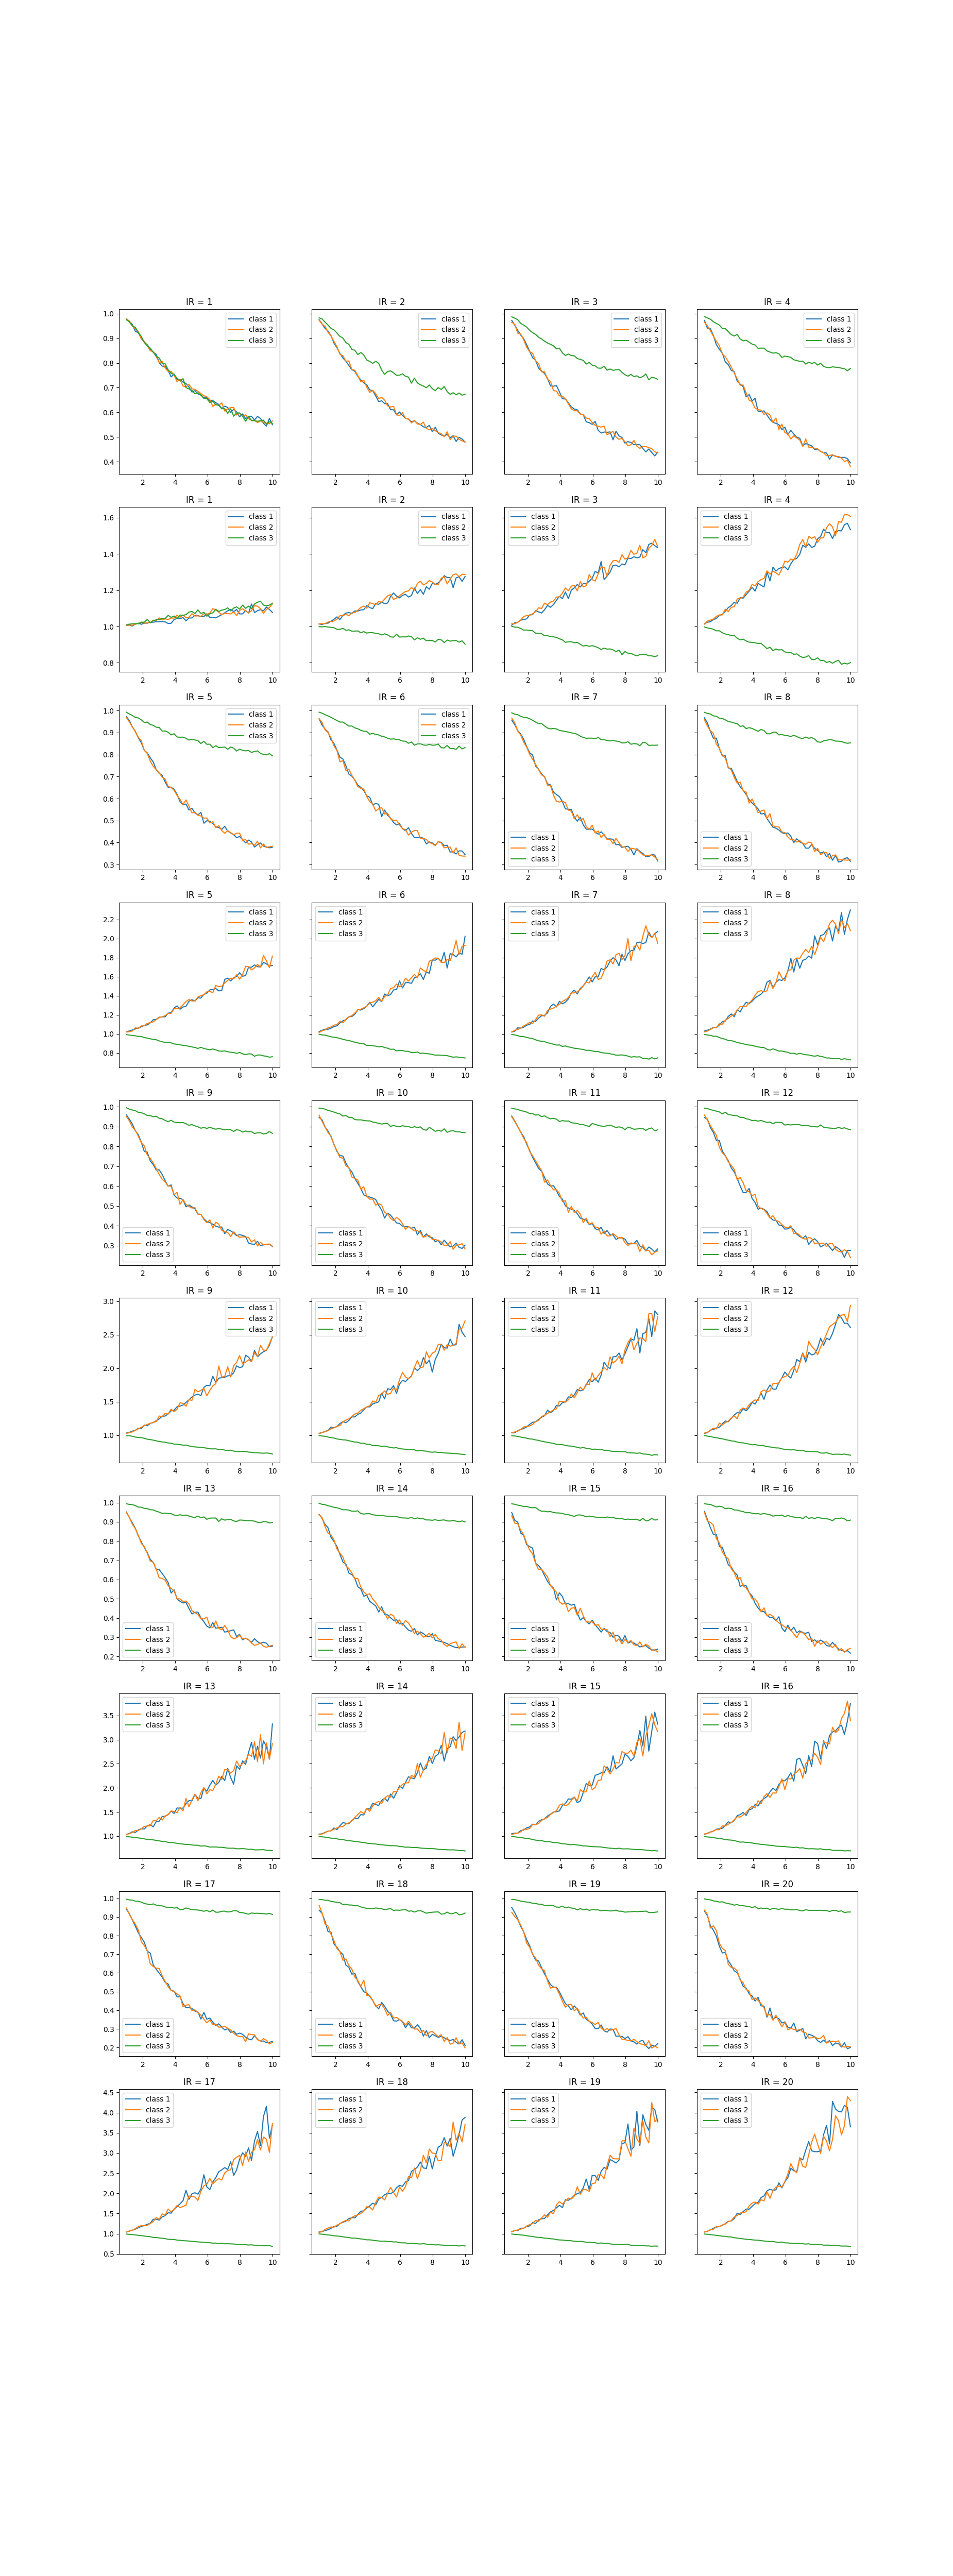
1.4 Decision Tree, datasets with 4 classes
Class recalls (odd rows) and OC Ratio (even rows) for the square datasets with imbalanced ratios (columns) from 1 to 20 versus class overlapping measured by standard deviation. Class 1 is the majority class whereas classes 2,3 and 4 are minority classes (except the balanced dataset were all classes have the same size).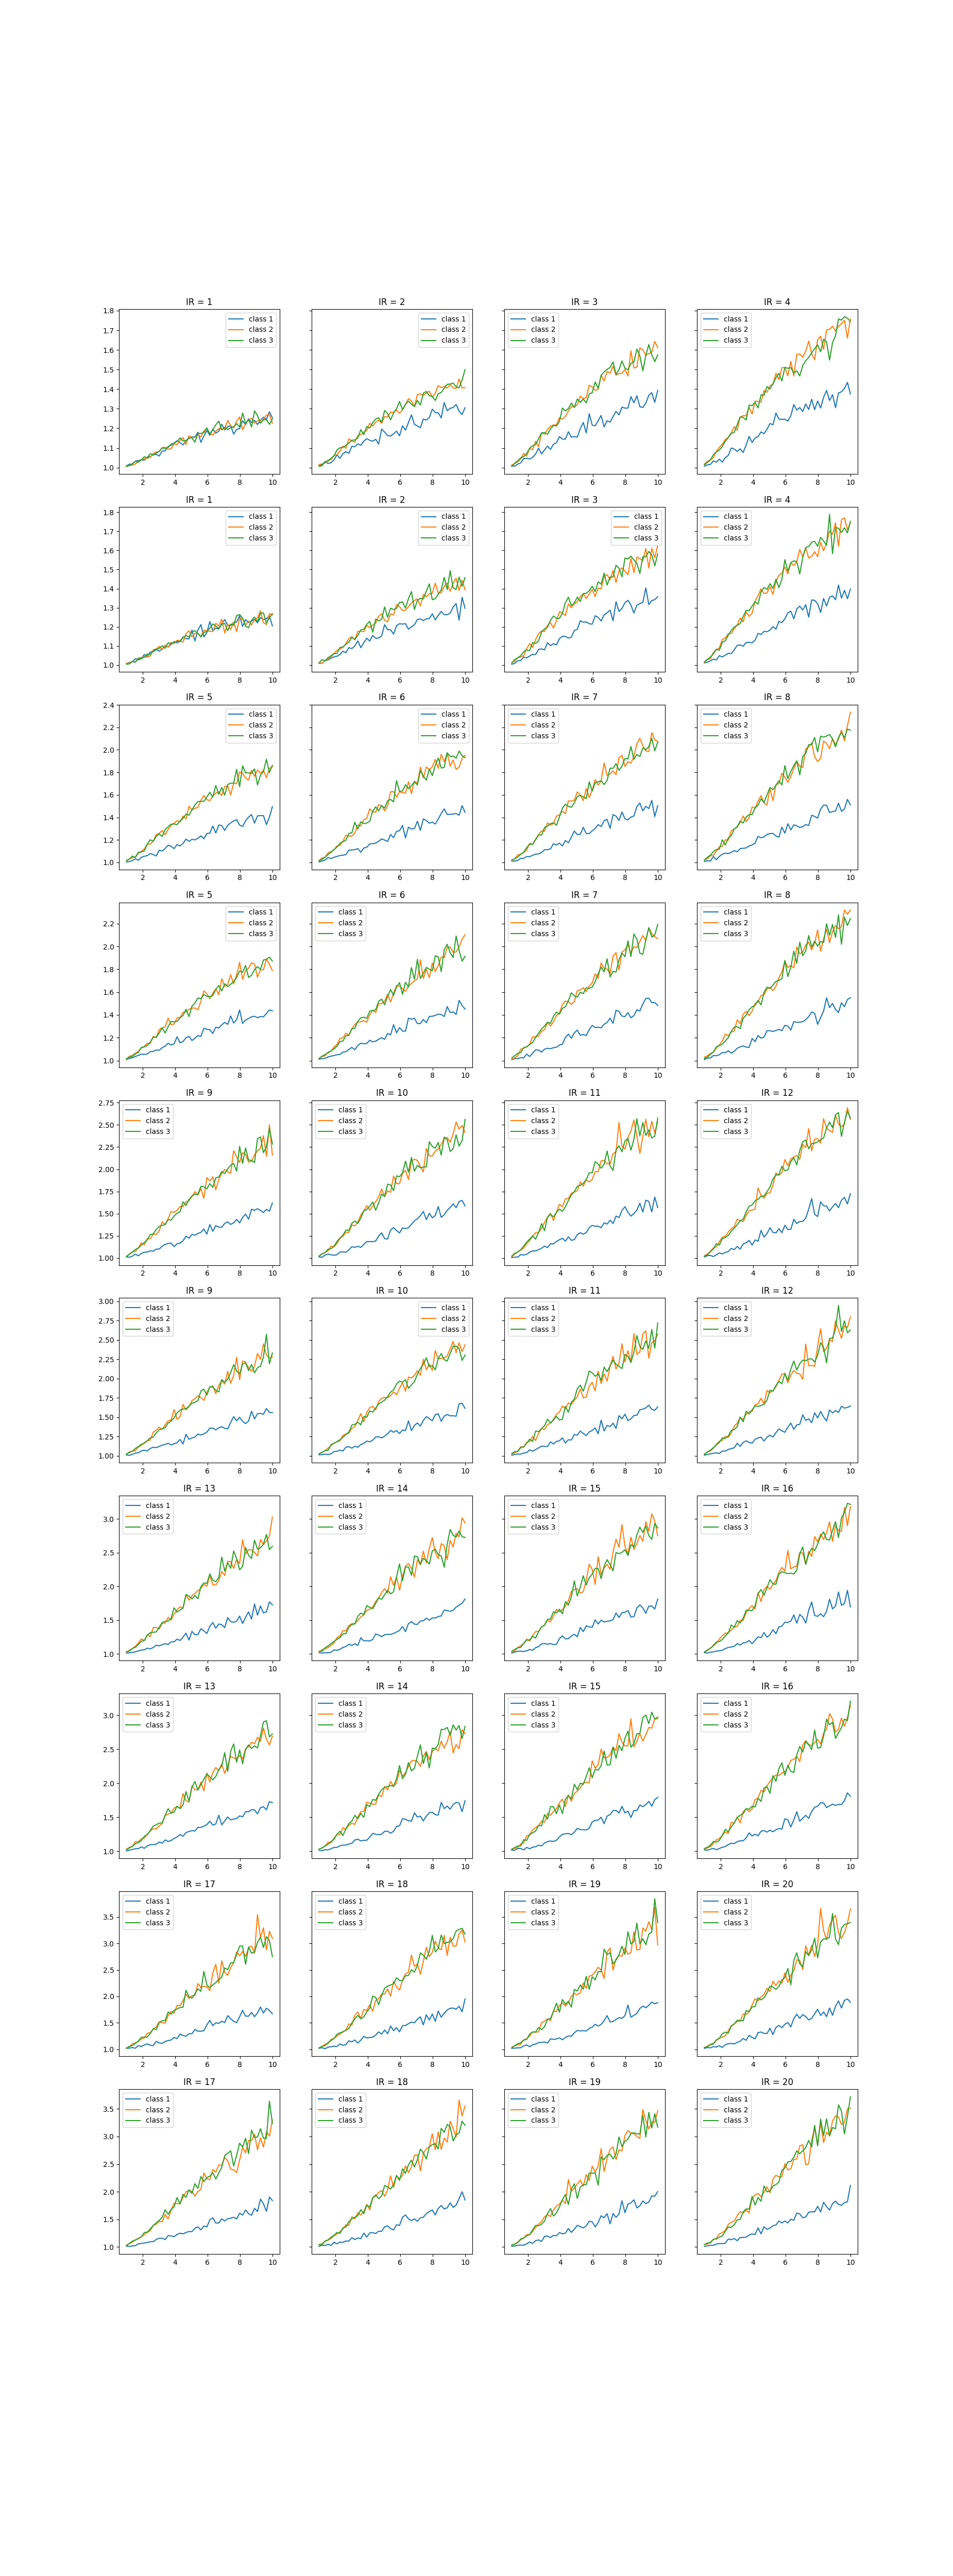
1.5 K-nearest neighbors, datasets with 4 classes
Class recalls (odd rows) and OC Ratio (even rows) for the square datasets with imbalanced ratios (columns) from 1 to 20 versus class overlapping measured by standard deviation. Class 1 is the majority class whereas classes 2,3 and 4 are minority classes (except the balanced dataset were all classes have the same size).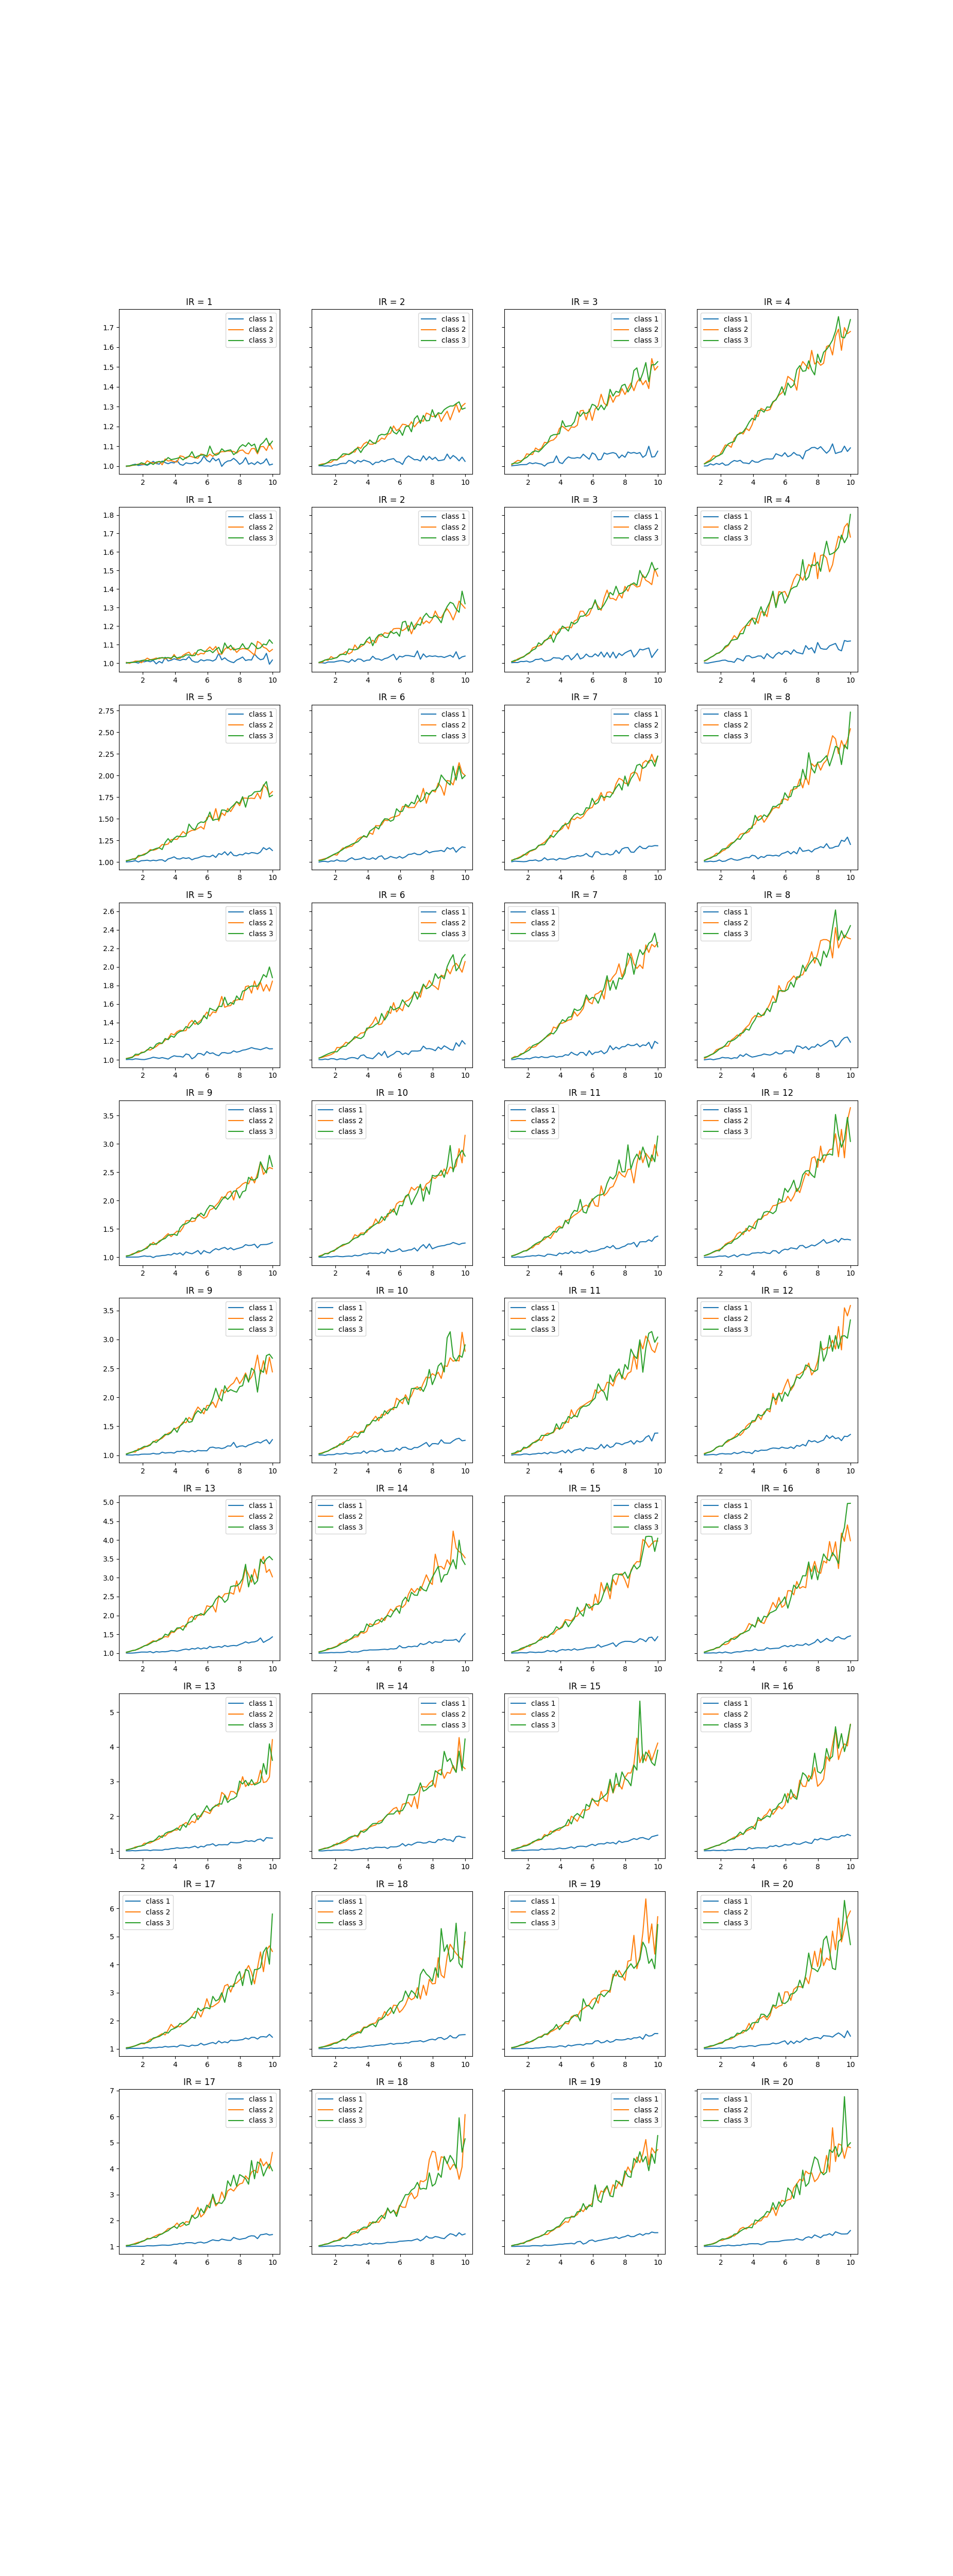
1.6 Bagging with 30 decision trees, datasets with 4 classes
Class recalls (odd rows) and OC Ratio (even rows) for the square datasets with imbalanced ratios (columns) from 1 to 20 versus class overlapping measured by standard deviation. Class 1 is the majority class whereas classes 2,3 and 4 are minority classes (except the balanced dataset were all classes have the same size).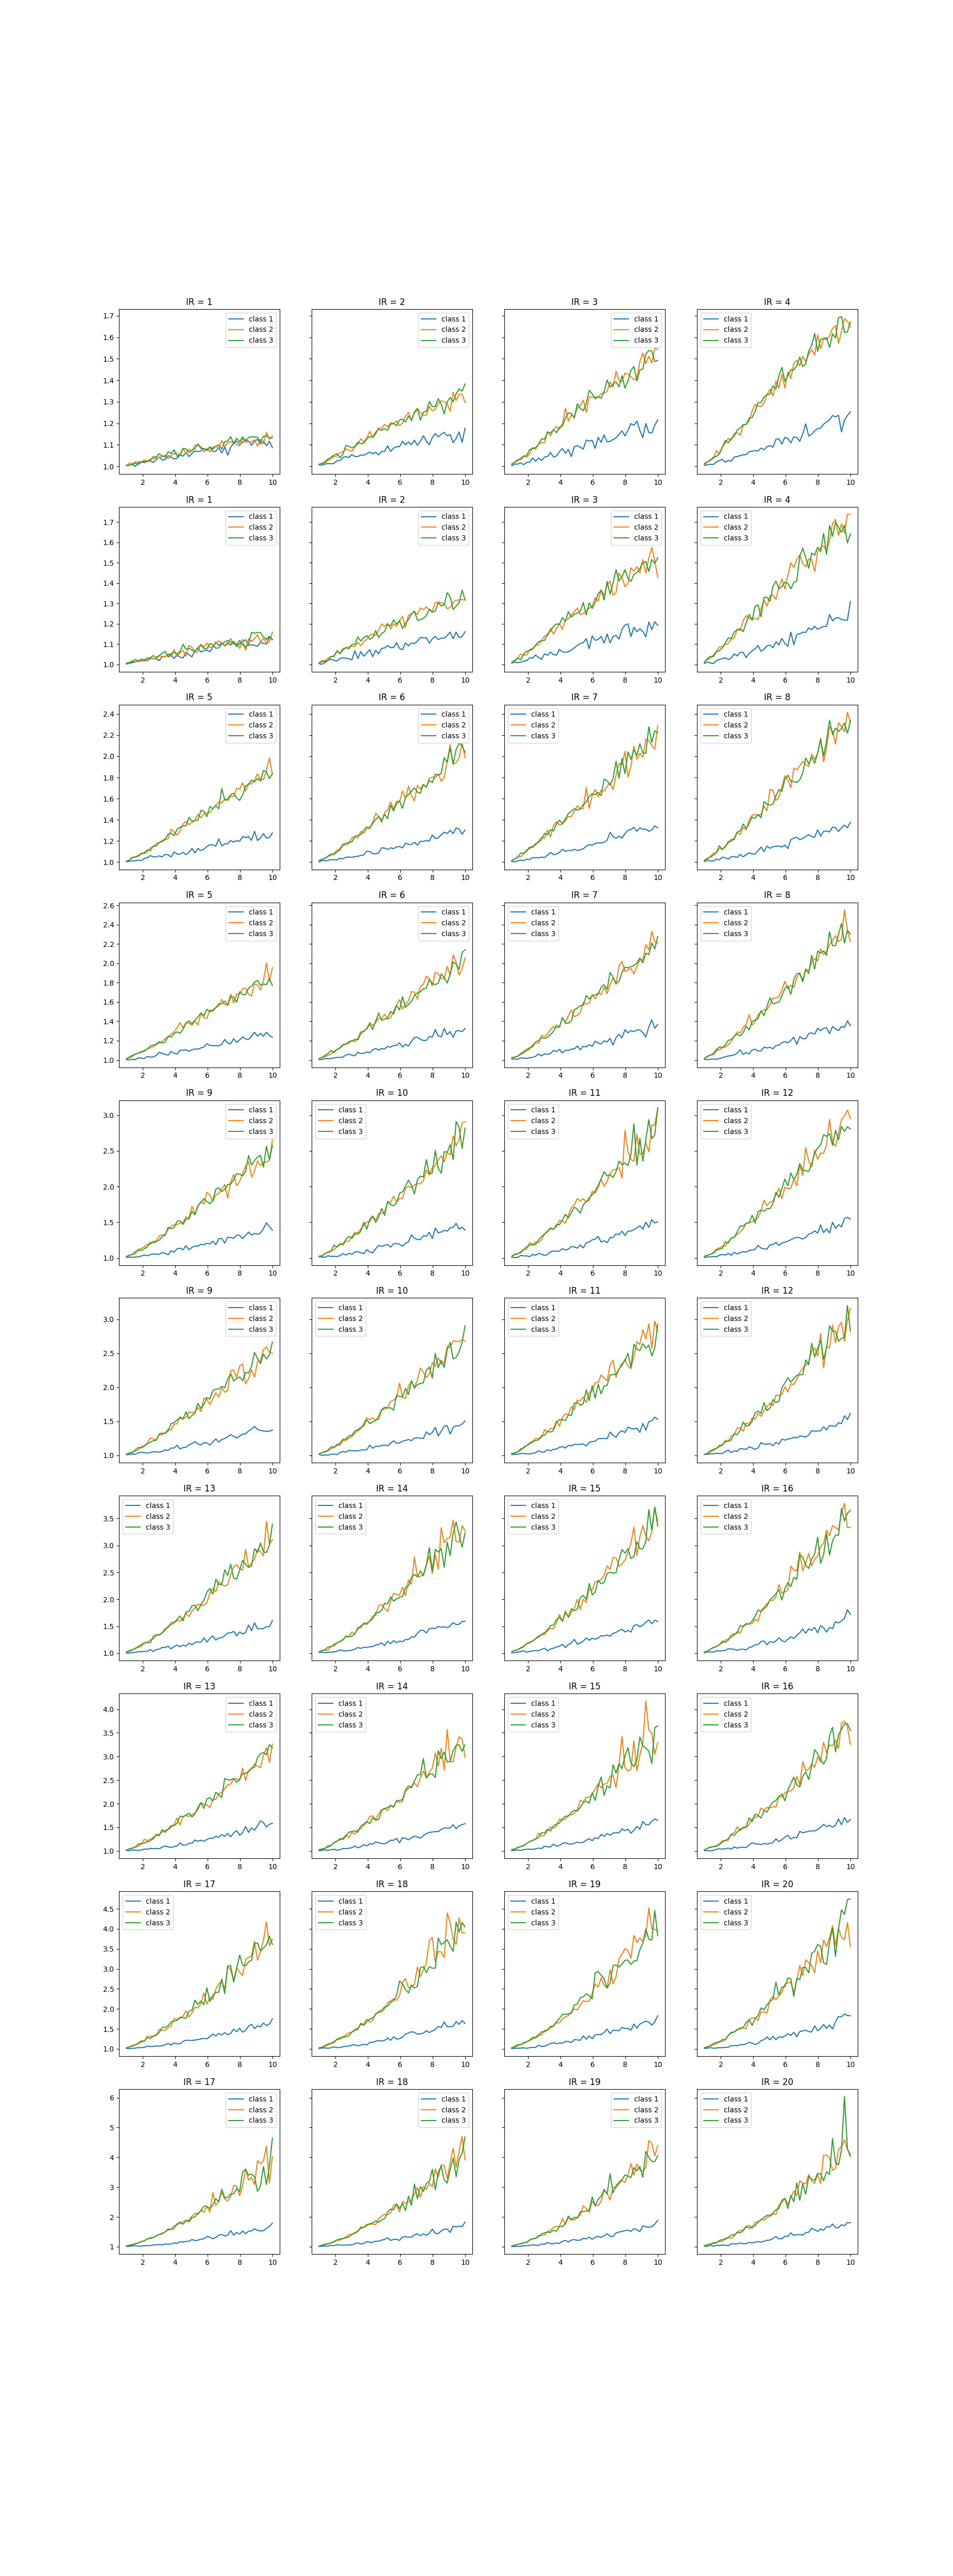
2 The role of the different class size configurations
2.1 Decision Tree, datasets with 3 classes
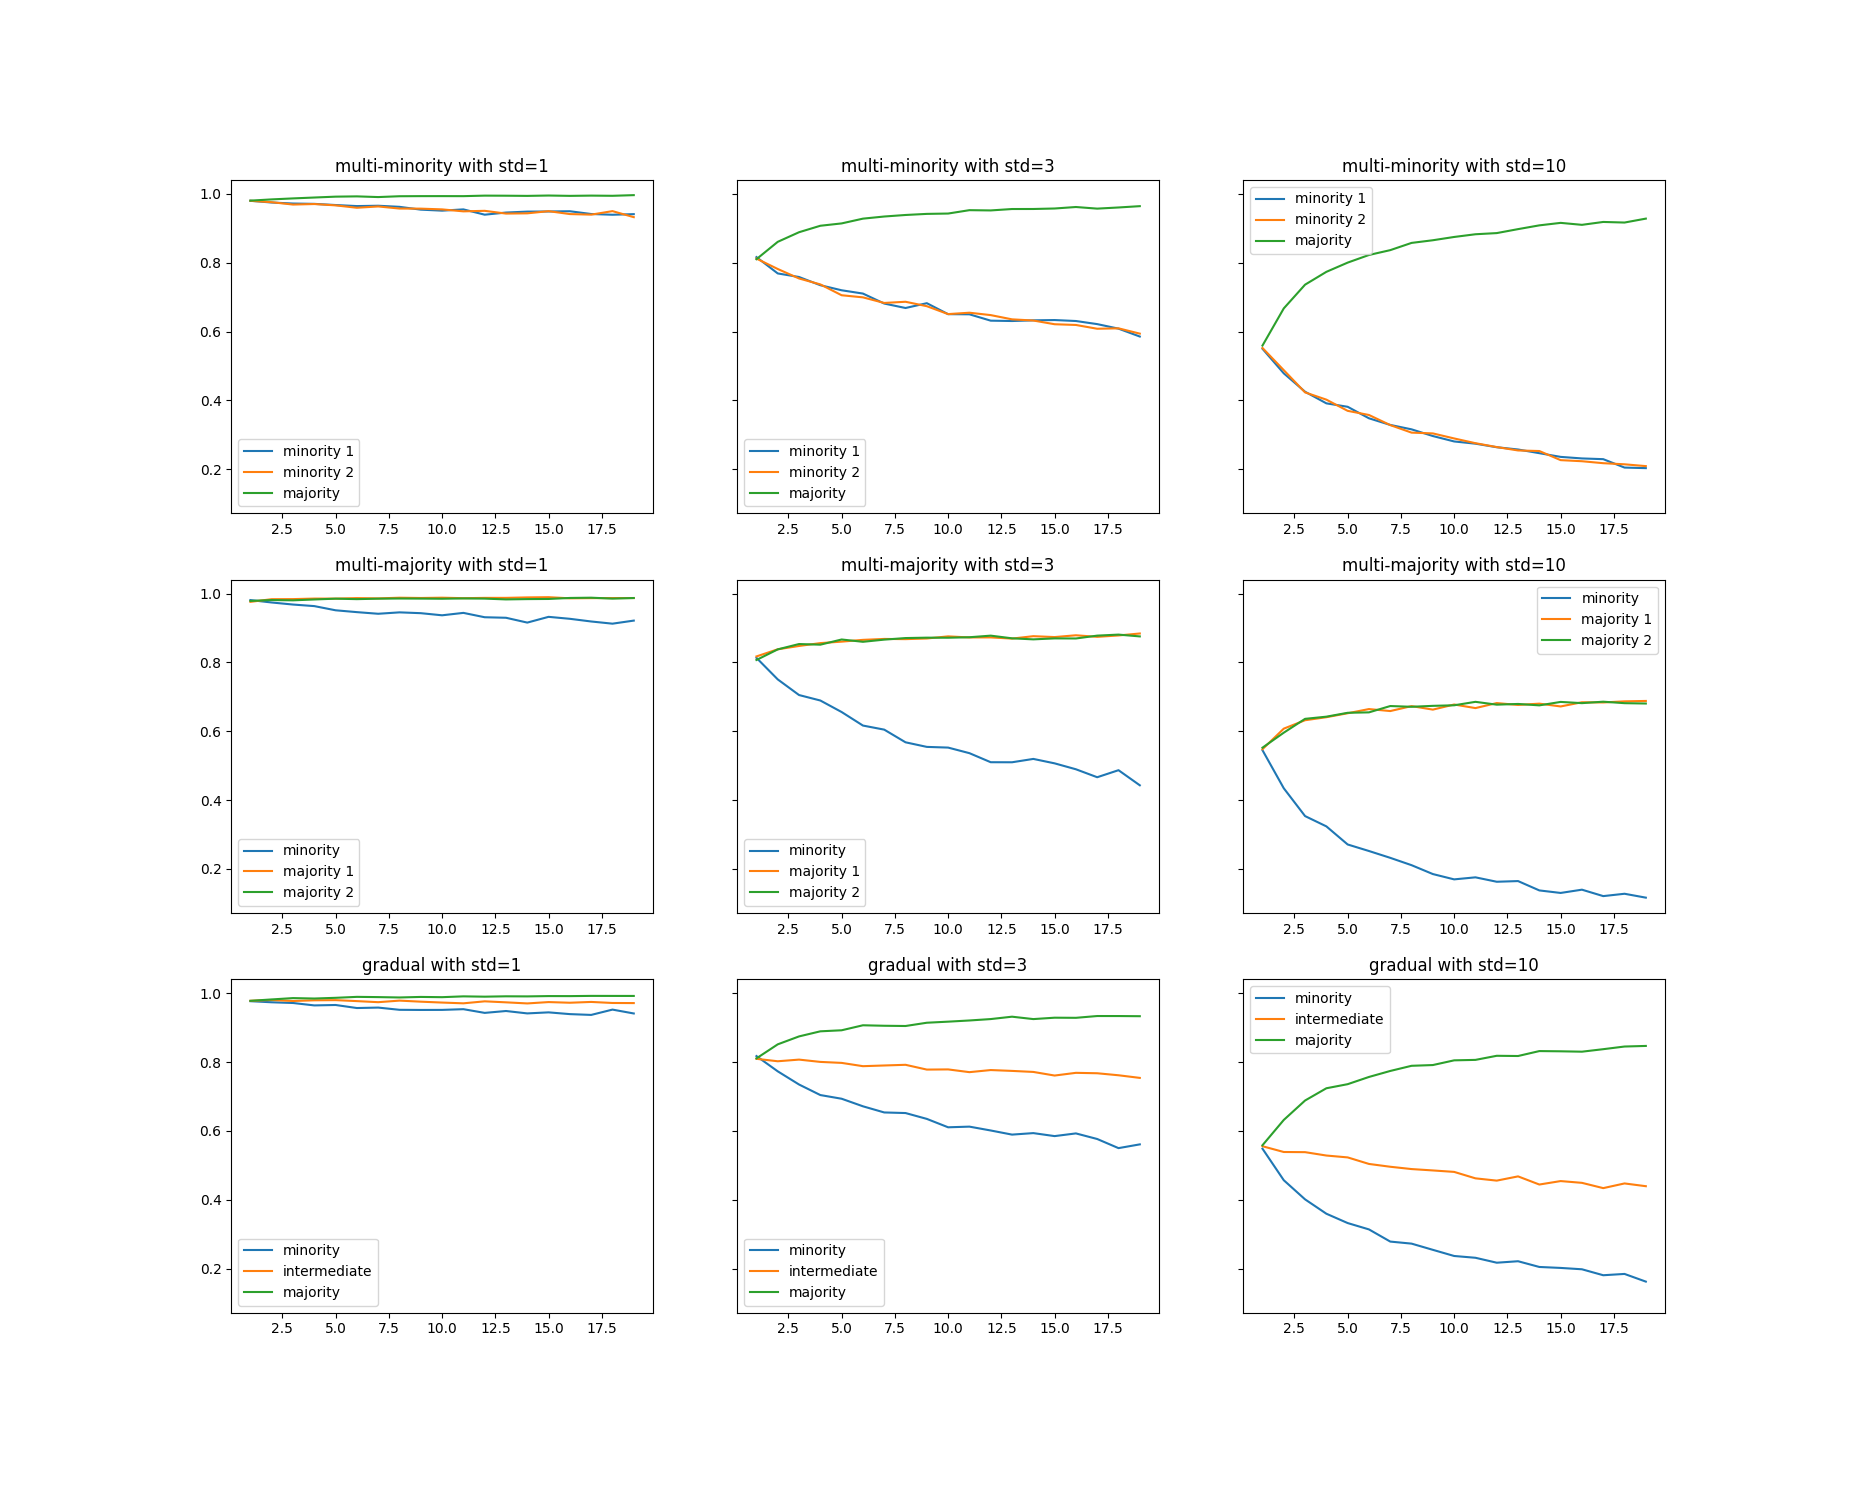
The values of OC Ratio obtained by the decision tree classifier on triangle datasets for the imbalanced ratio IR growing from 1 to 20 with three different class overlapping std in {1, 3, 10} (columns) and three different types of class distributions (represented in next rows).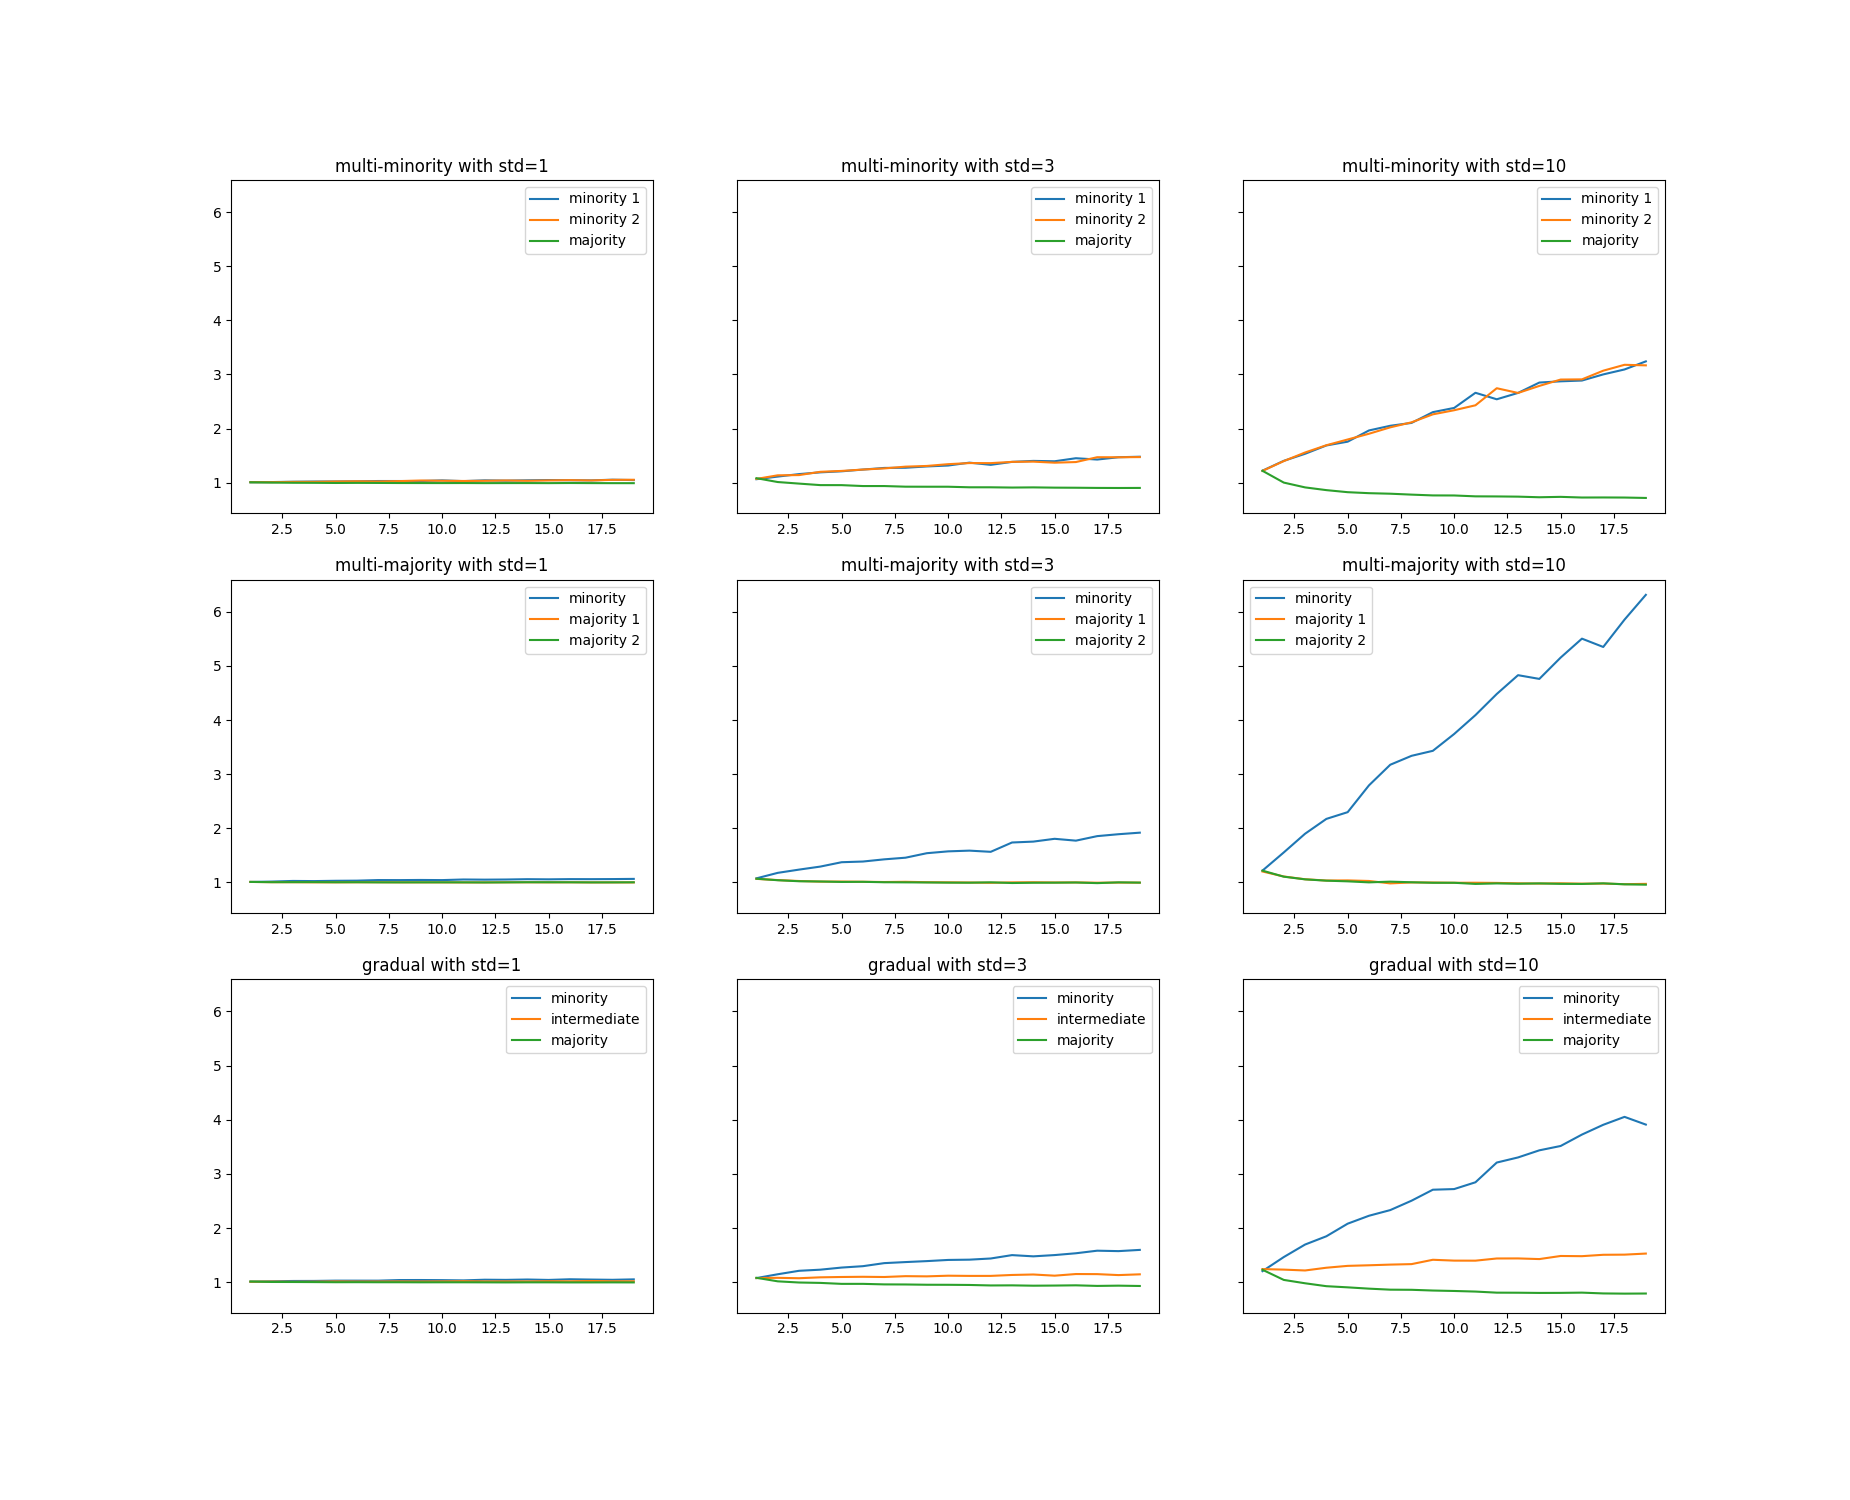 The values of Recall obtained by the decision tree classifier on triangle datasets for the imbalanced ratio IR growing
from 1 to 20 with three different class overlapping std in {1, 3, 10} (columns) and three different types of class distributions
(represented in next rows).
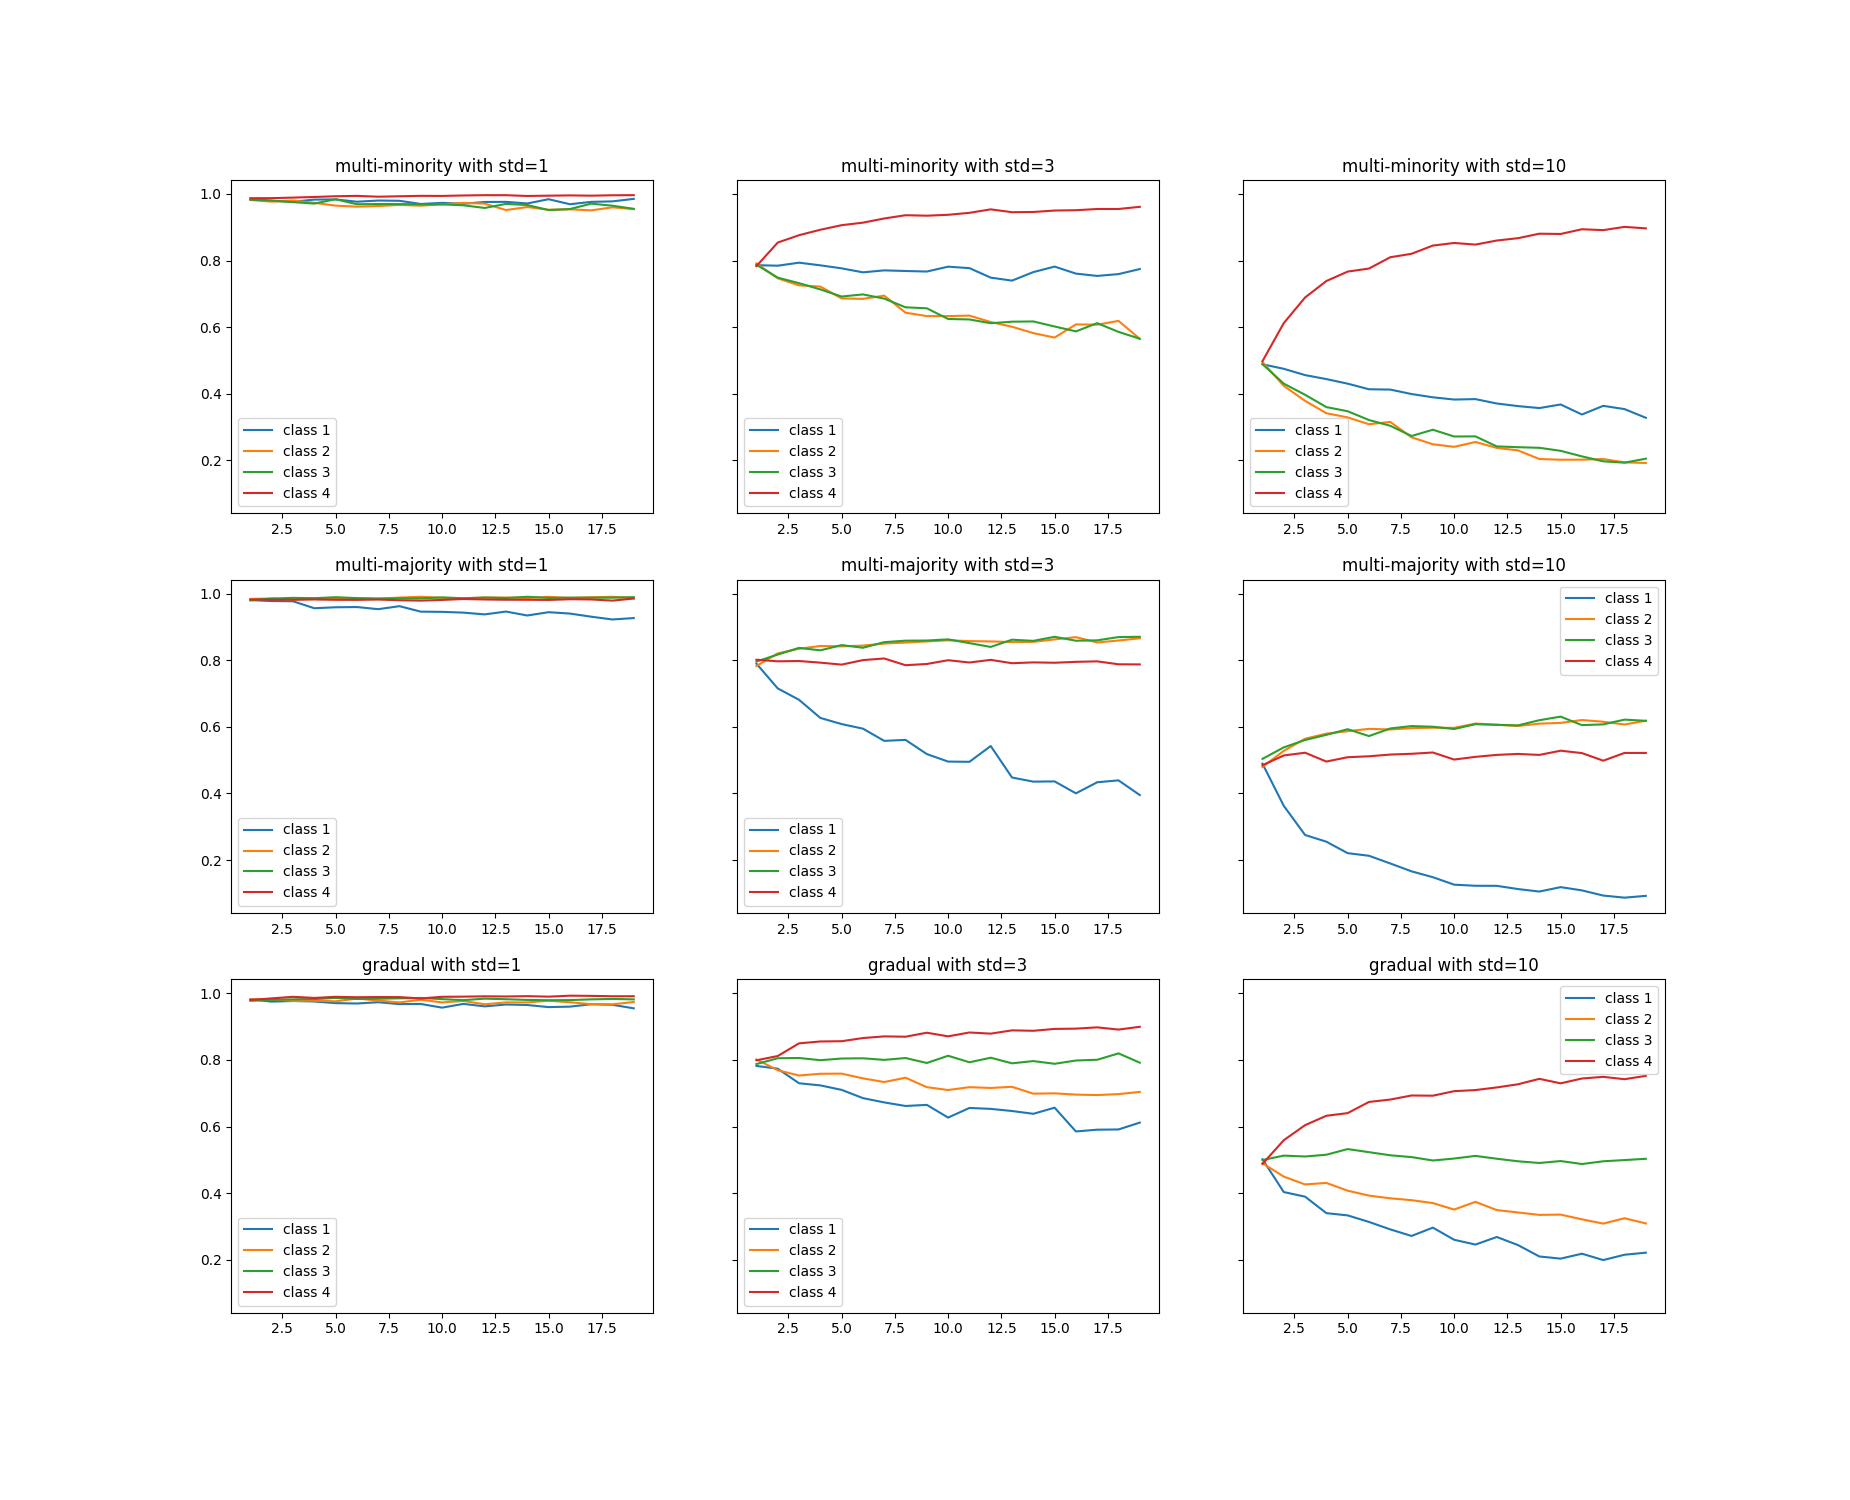
The values of Recall obtained by the decision tree classifier on triangle datasets for the imbalanced ratio IR growing
from 1 to 20 with three different class overlapping std in {1, 3, 10} (columns) and three different types of class distributions
(represented in next rows).
2.2 K-nearest neighbors, datasets with 3 classes
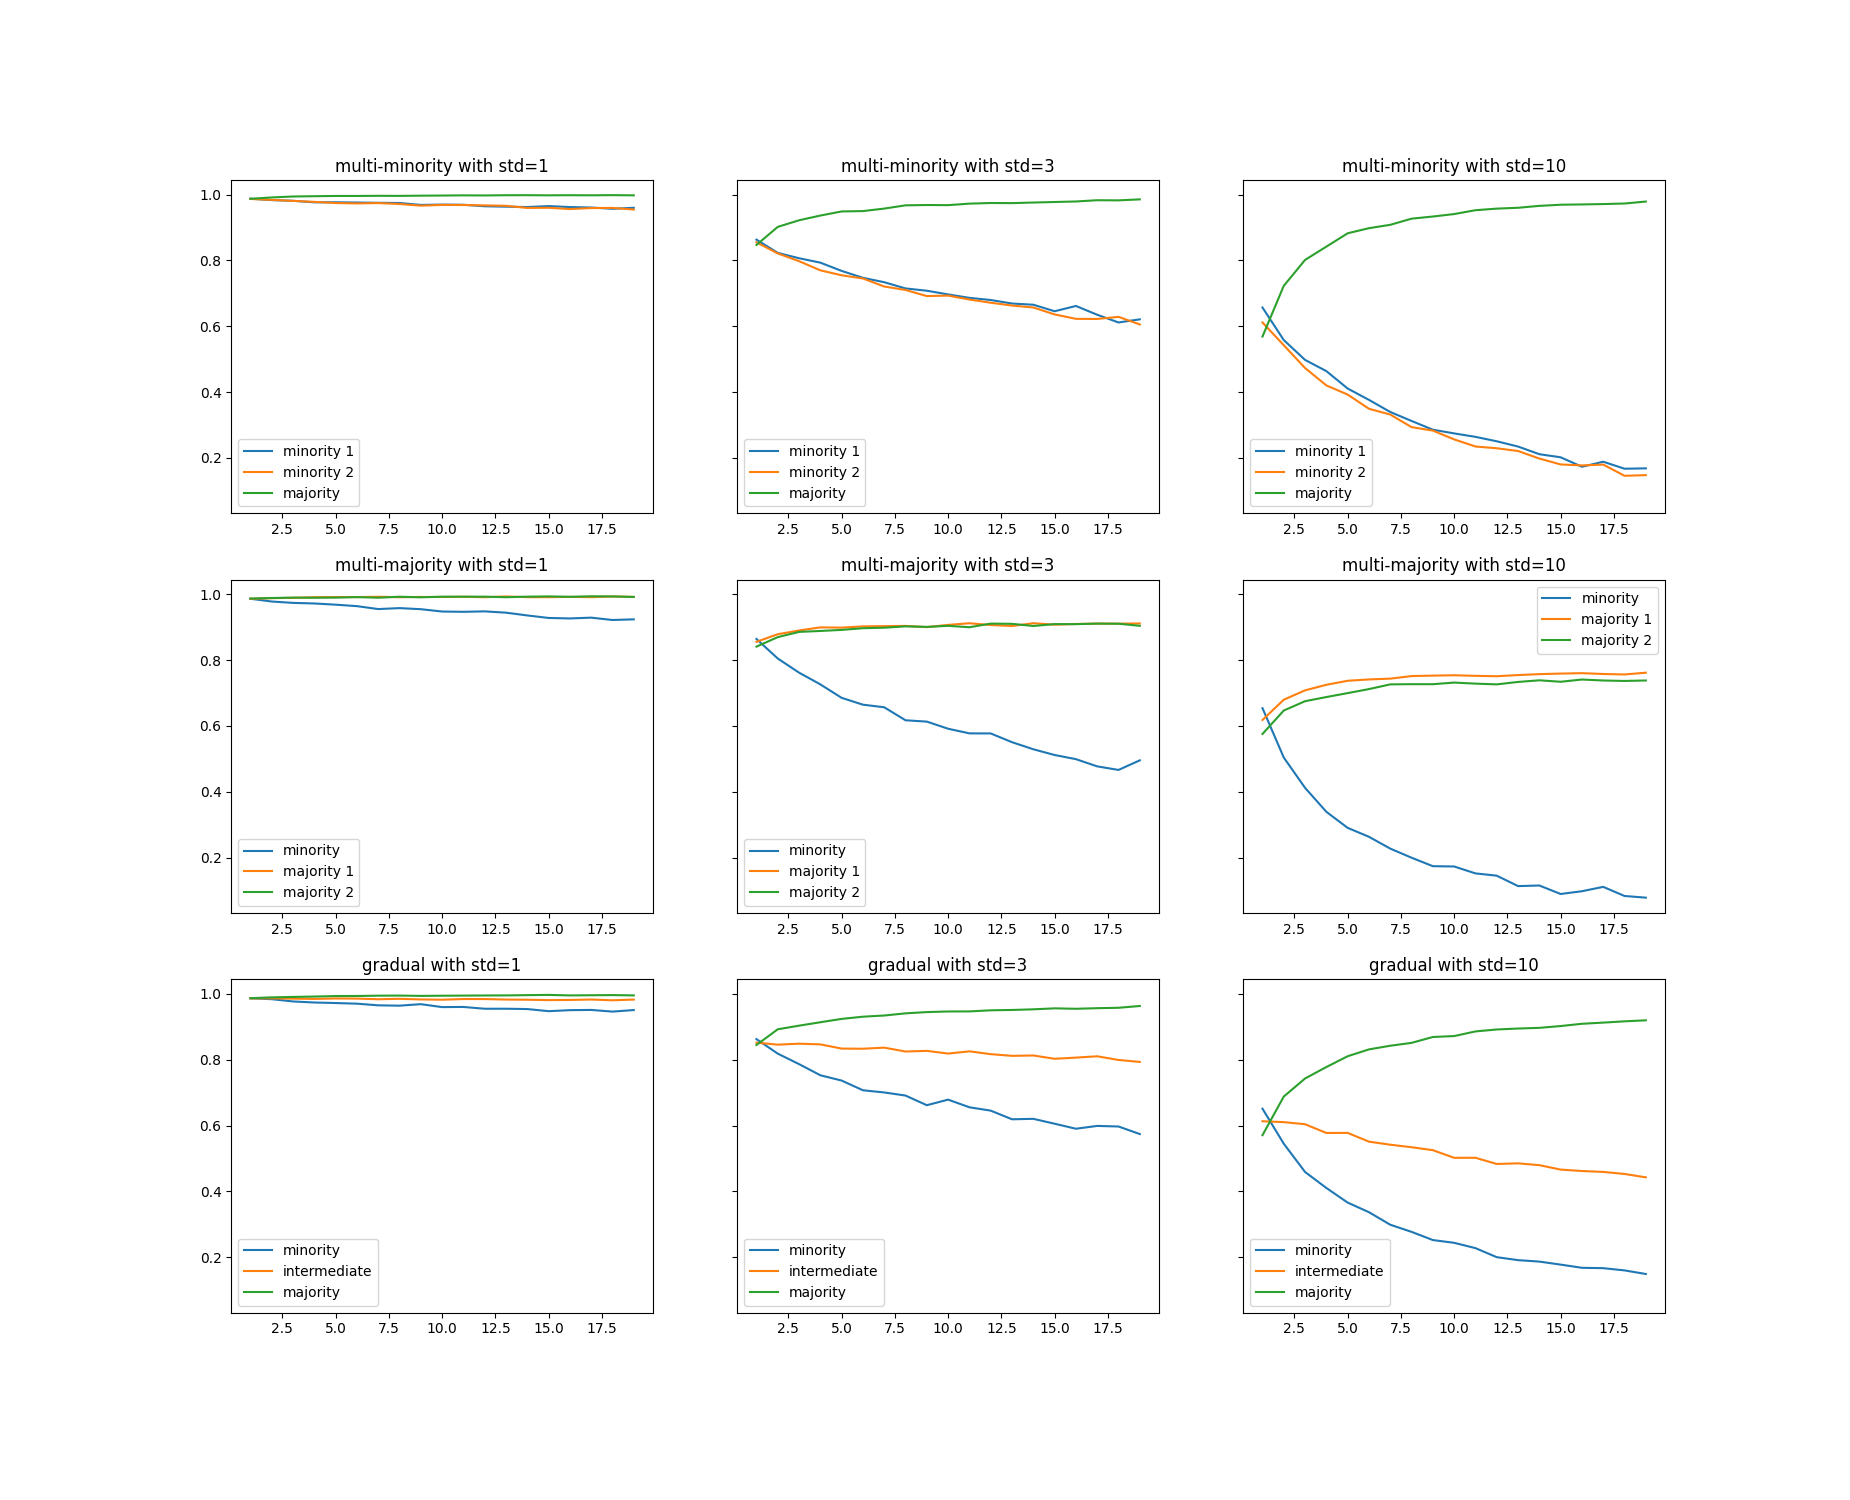
The values of OC Ratio obtained by the kNN classifier on triangle datasets for the imbalanced ratio IR growing from 1 to 20 with three different class overlapping std in {1, 3, 10} (columns) and three different types of class distributions (represented in next rows).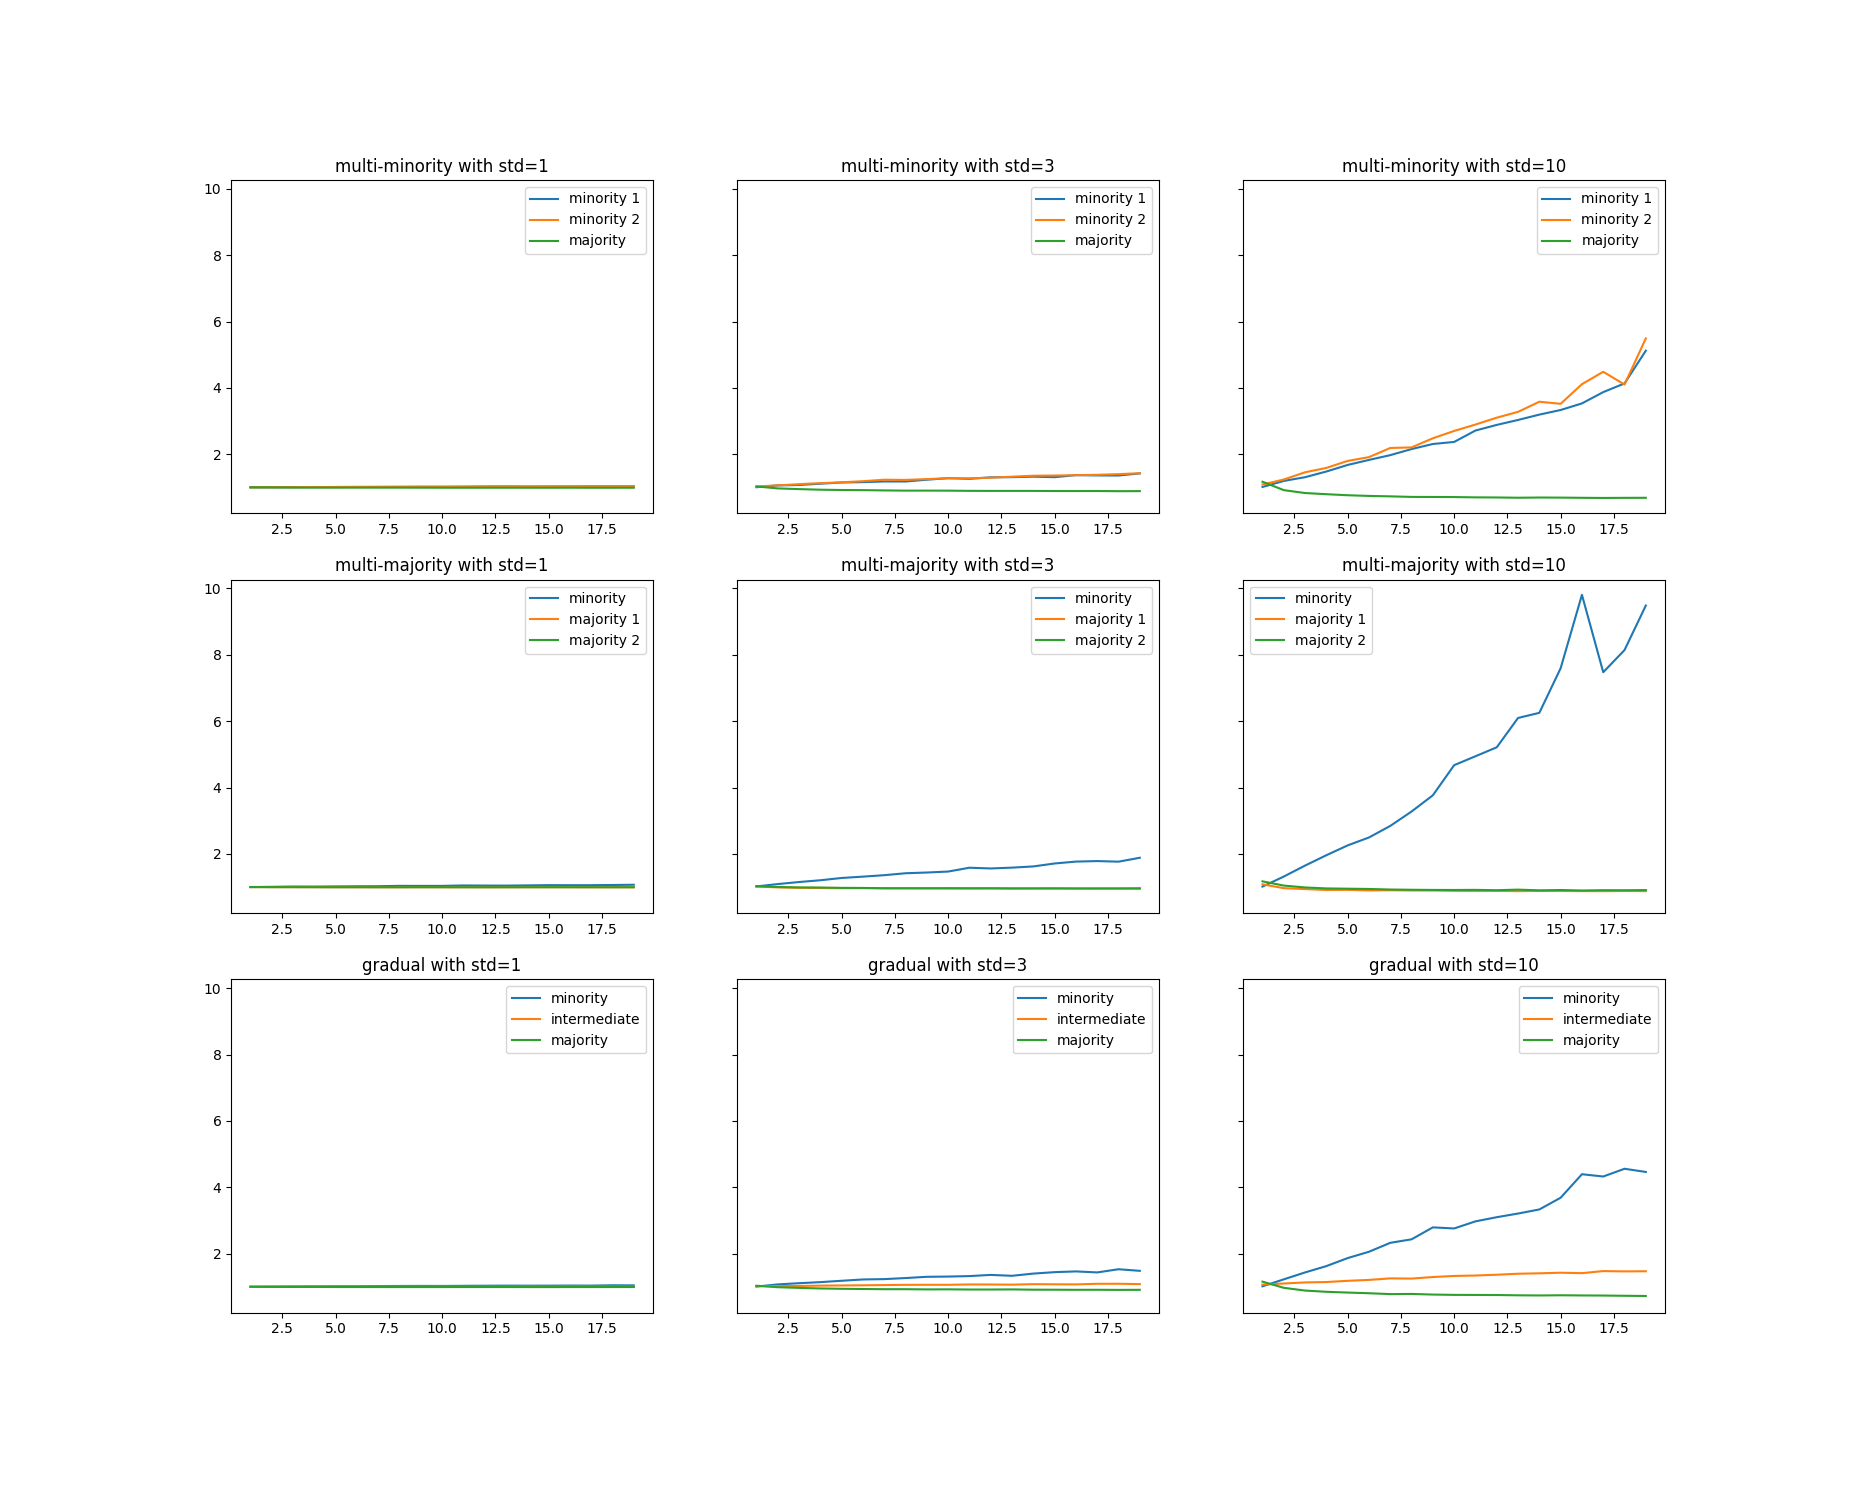 The values of Recall obtained by the kNN classifier on triangle datasets for the imbalanced ratio IR growing
from 1 to 20 with three different class overlapping std in {1, 3, 10} (columns) and three different types of class distributions
(represented in next rows).
The values of Recall obtained by the kNN classifier on triangle datasets for the imbalanced ratio IR growing
from 1 to 20 with three different class overlapping std in {1, 3, 10} (columns) and three different types of class distributions
(represented in next rows).
2.3 Bagging with 30 decision trees, datasets with 3 classes
The values of OC Ratio obtained by the bagging classifier on triangle datasets for the imbalanced ratio IR growing from 1 to 20 with three different class overlapping std in {1, 3, 10} (columns) and three different types of class distributions (represented in next rows).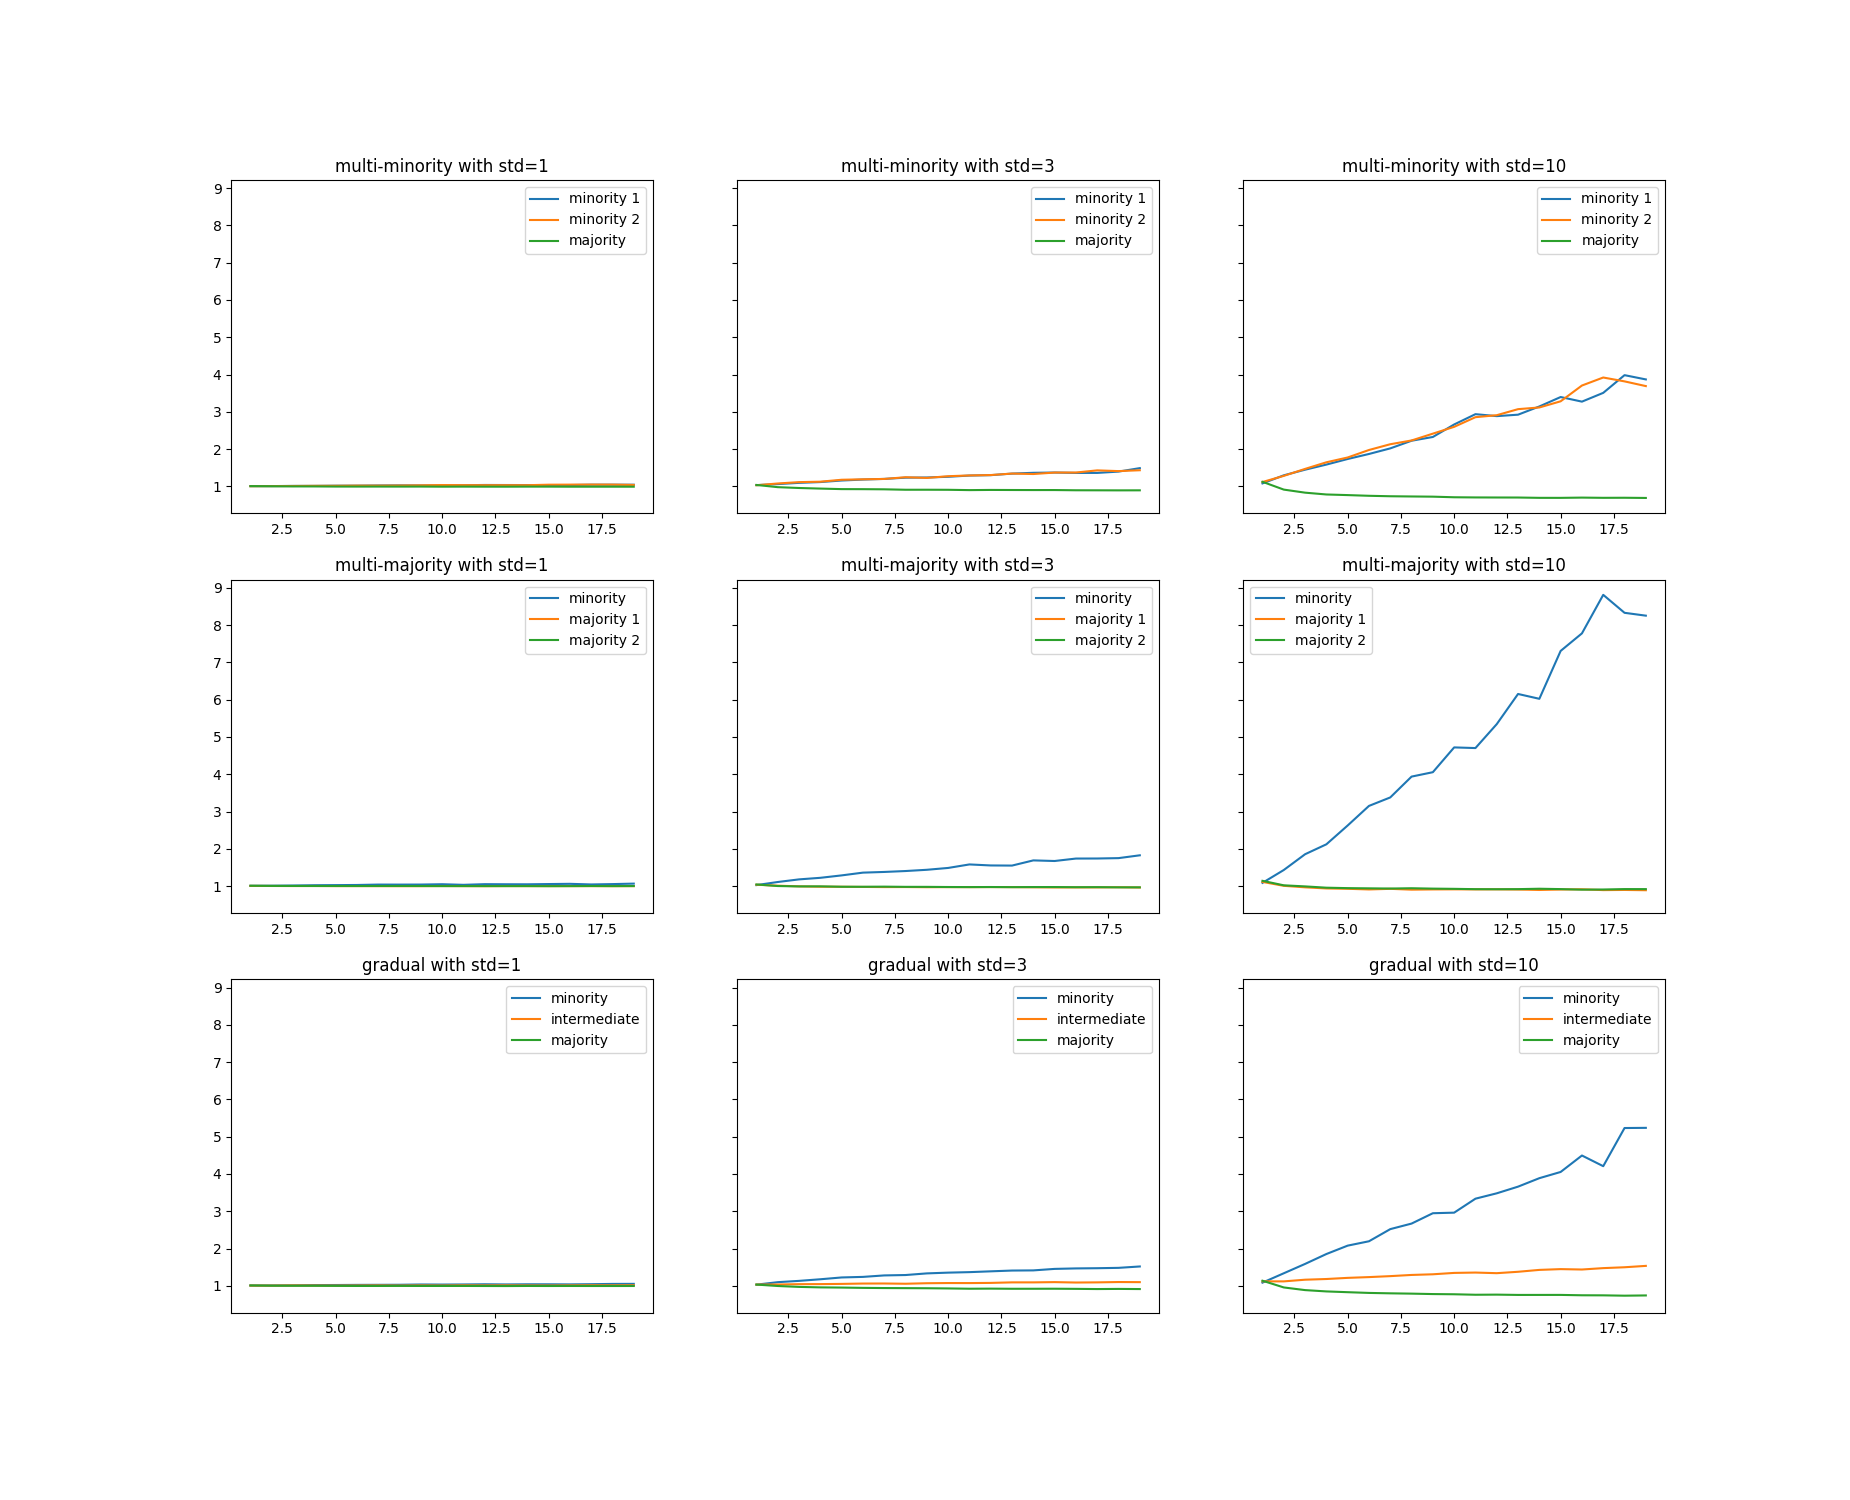 The values of Recall obtained by the bagging classifier on triangle datasets for the imbalanced ratio IR growing
from 1 to 20 with three different class overlapping std in {1, 3, 10} (columns) and three different types of class distributions
(represented in next rows).
The values of Recall obtained by the bagging classifier on triangle datasets for the imbalanced ratio IR growing
from 1 to 20 with three different class overlapping std in {1, 3, 10} (columns) and three different types of class distributions
(represented in next rows).
2.4 Decision Tree, datasets with 4 classes
The values of OC Ratio obtained by the decision tree classifier on square datasets for the imbalanced ratio IR growing from 1 to 20 with three different class overlapping std in {1, 3, 10} (columns) and three different types of class distributions (represented in next rows).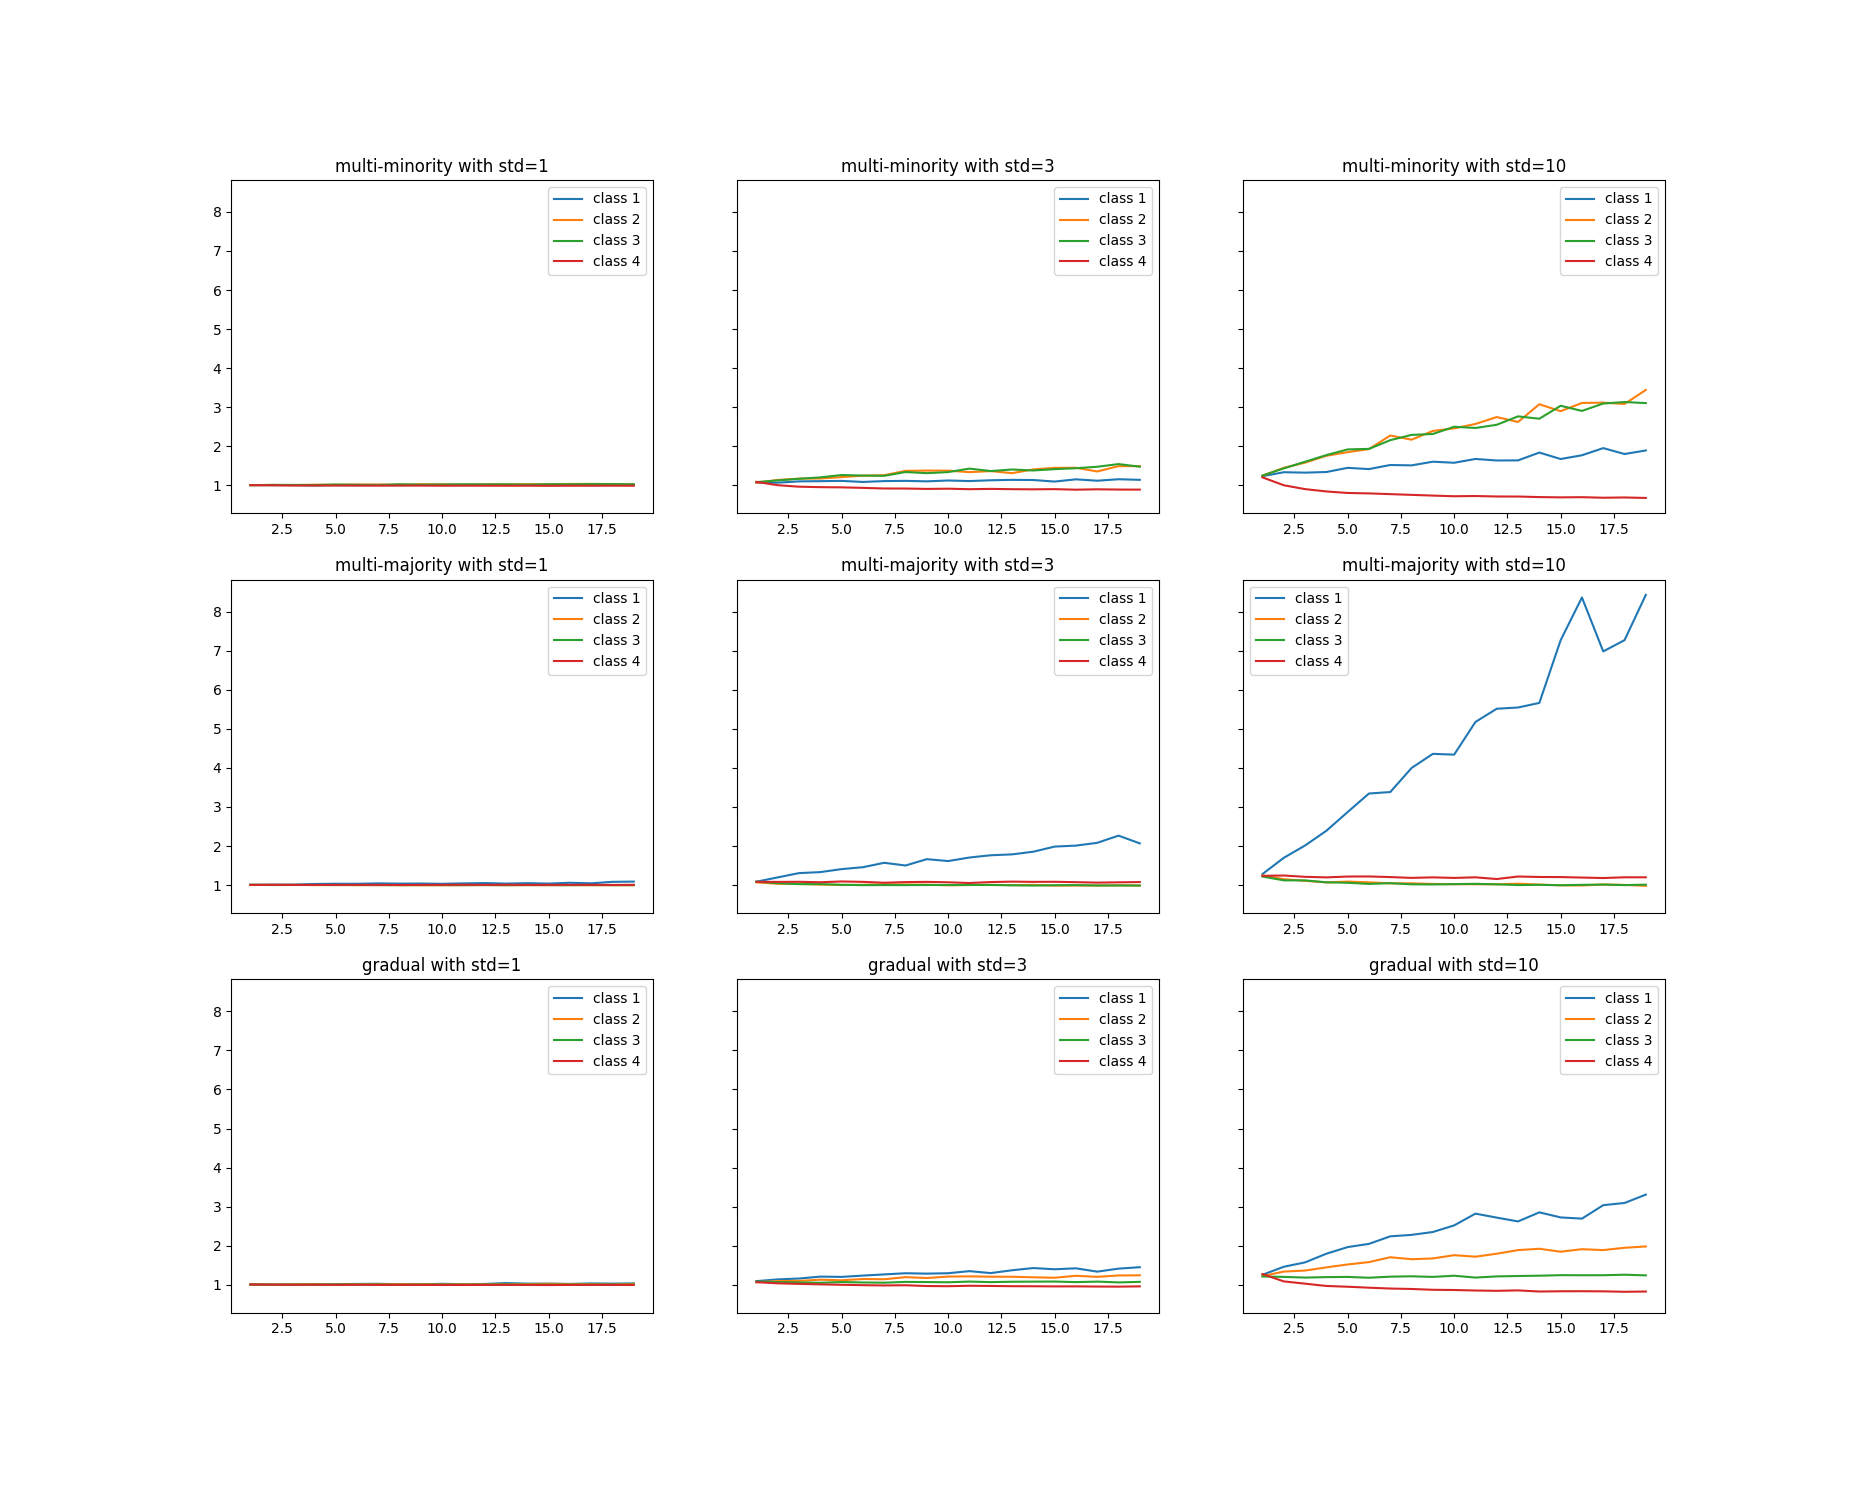 The values of Recall obtained by the decision tree classifier on square datasets for the imbalanced ratio IR growing
from 1 to 20 with three different class overlapping std in {1, 3, 10} (columns) and three different types of class distributions
(represented in next rows).
The values of Recall obtained by the decision tree classifier on square datasets for the imbalanced ratio IR growing
from 1 to 20 with three different class overlapping std in {1, 3, 10} (columns) and three different types of class distributions
(represented in next rows).
2.5 K-nearest neighbors, datasets with 4 classes
The values of OC Ratio obtained by the kNN classifier on square datasets for the imbalanced ratio IR growing from 1 to 20 with three different class overlapping std in {1, 3, 10} (columns) and three different types of class distributions (represented in next rows).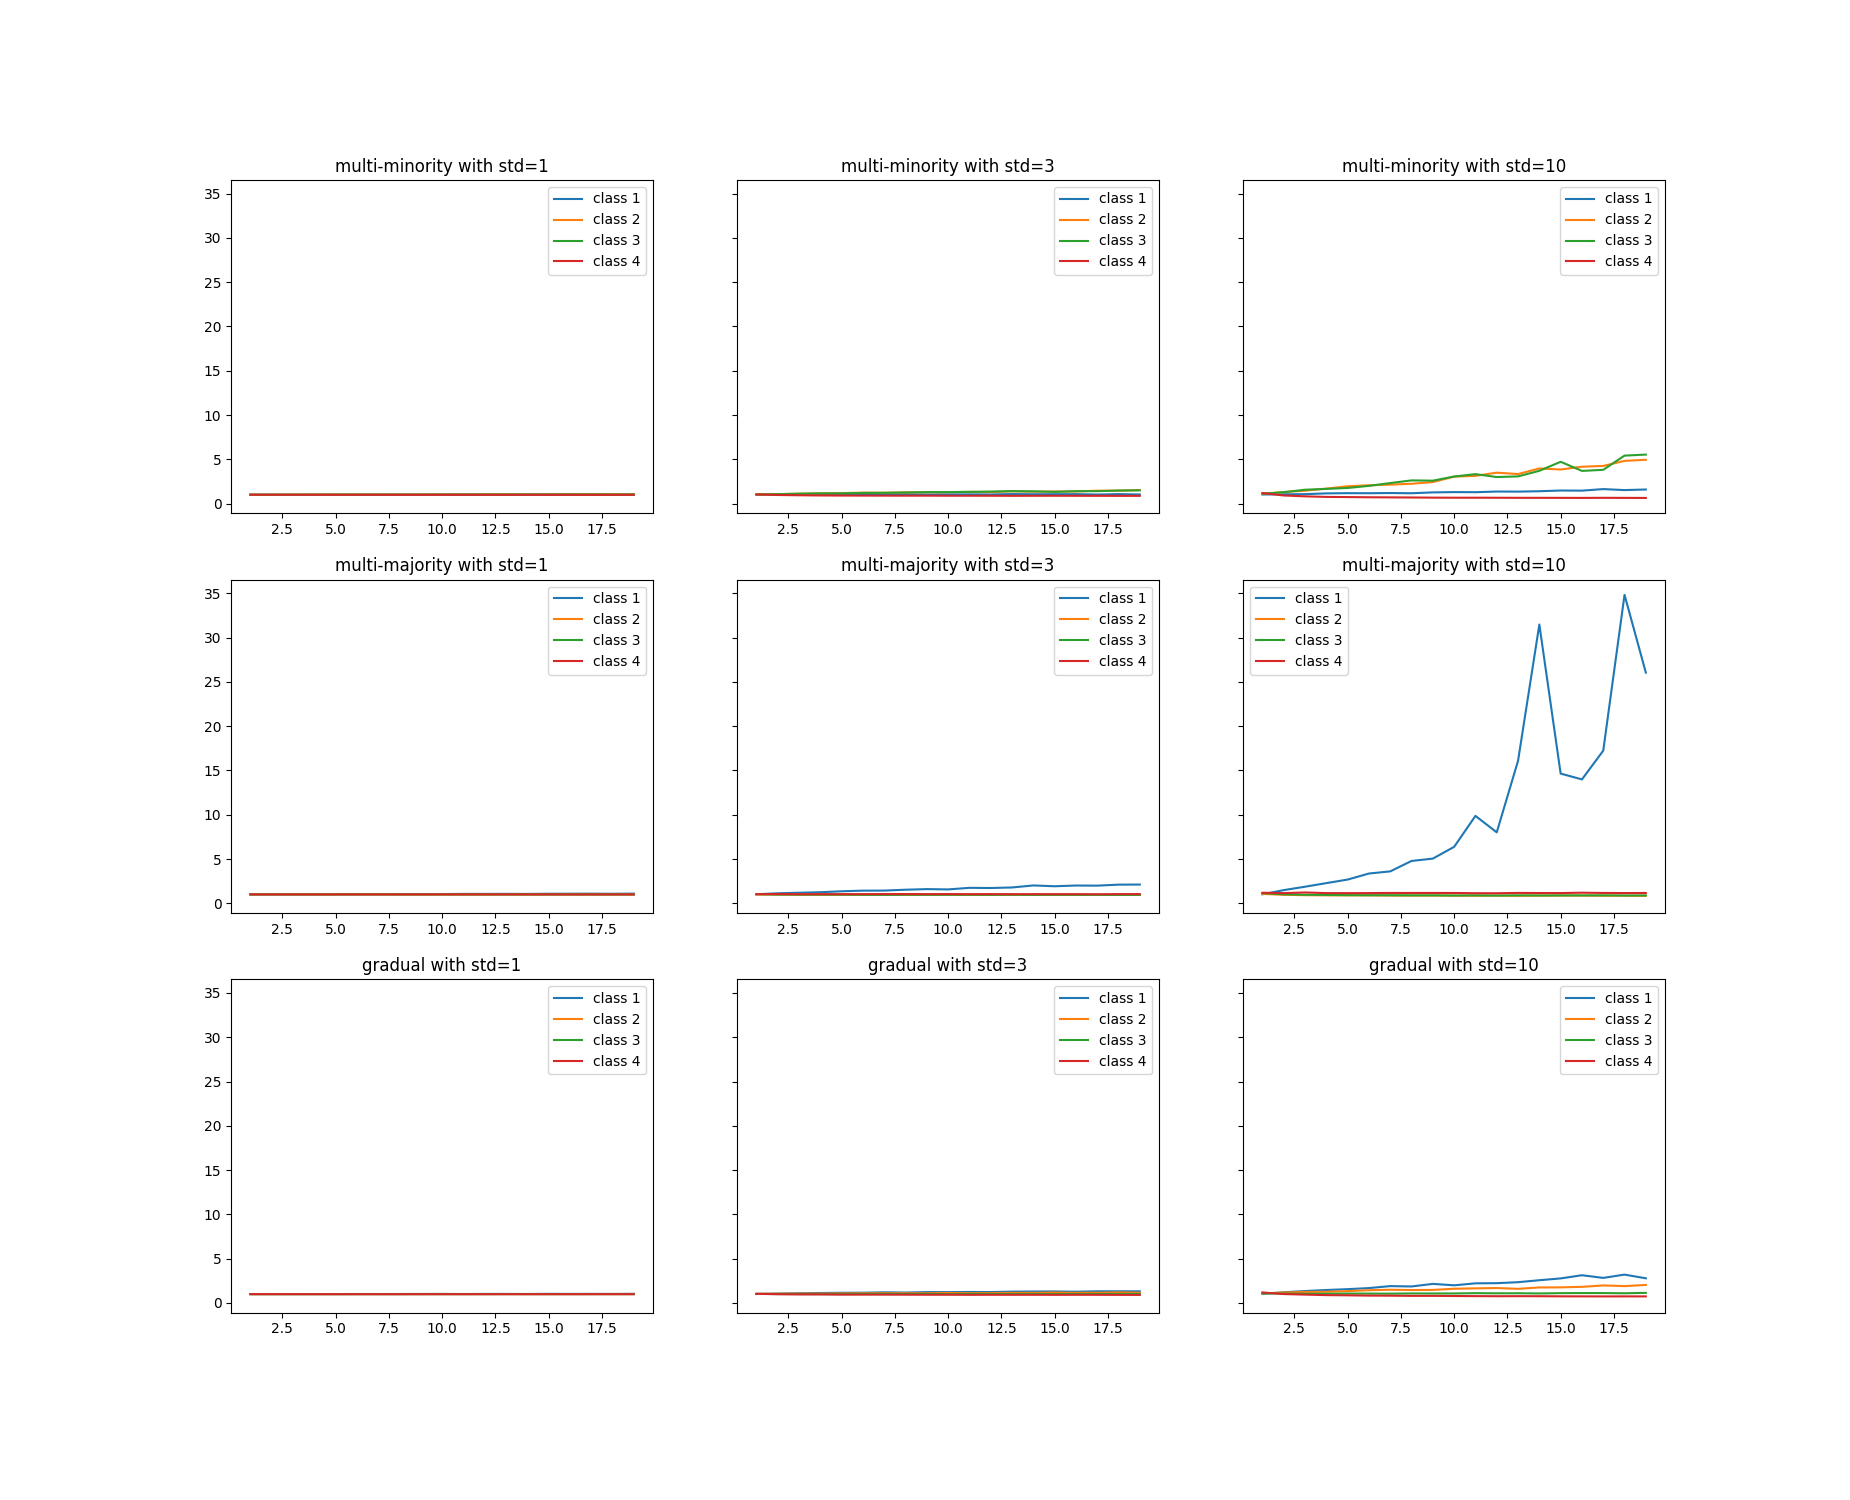 The values of Recall obtained by the kNN classifier on square datasets for the imbalanced ratio IR growing
from 1 to 20 with three different class overlapping std in {1, 3, 10} (columns) and three different types of class distributions
(represented in next rows).
The values of Recall obtained by the kNN classifier on square datasets for the imbalanced ratio IR growing
from 1 to 20 with three different class overlapping std in {1, 3, 10} (columns) and three different types of class distributions
(represented in next rows).
2.6 Bagging with 30 decision trees, datasets with 4 classes
The values of OC Ratio obtained by the bagging classifier on square datasets for the imbalanced ratio IR growing from 1 to 20 with three different class overlapping std in {1, 3, 10} (columns) and three different types of class distributions (represented in next rows).
The values of Recall obtained by the bagging classifier on square datasets for the imbalanced ratio IR growing
from 1 to 20 with three different class overlapping std in {1, 3, 10} (columns) and three different types of class distributions
(represented in next rows).
3 Overlapping and interrelation between different class types
3.1 Decision Tree
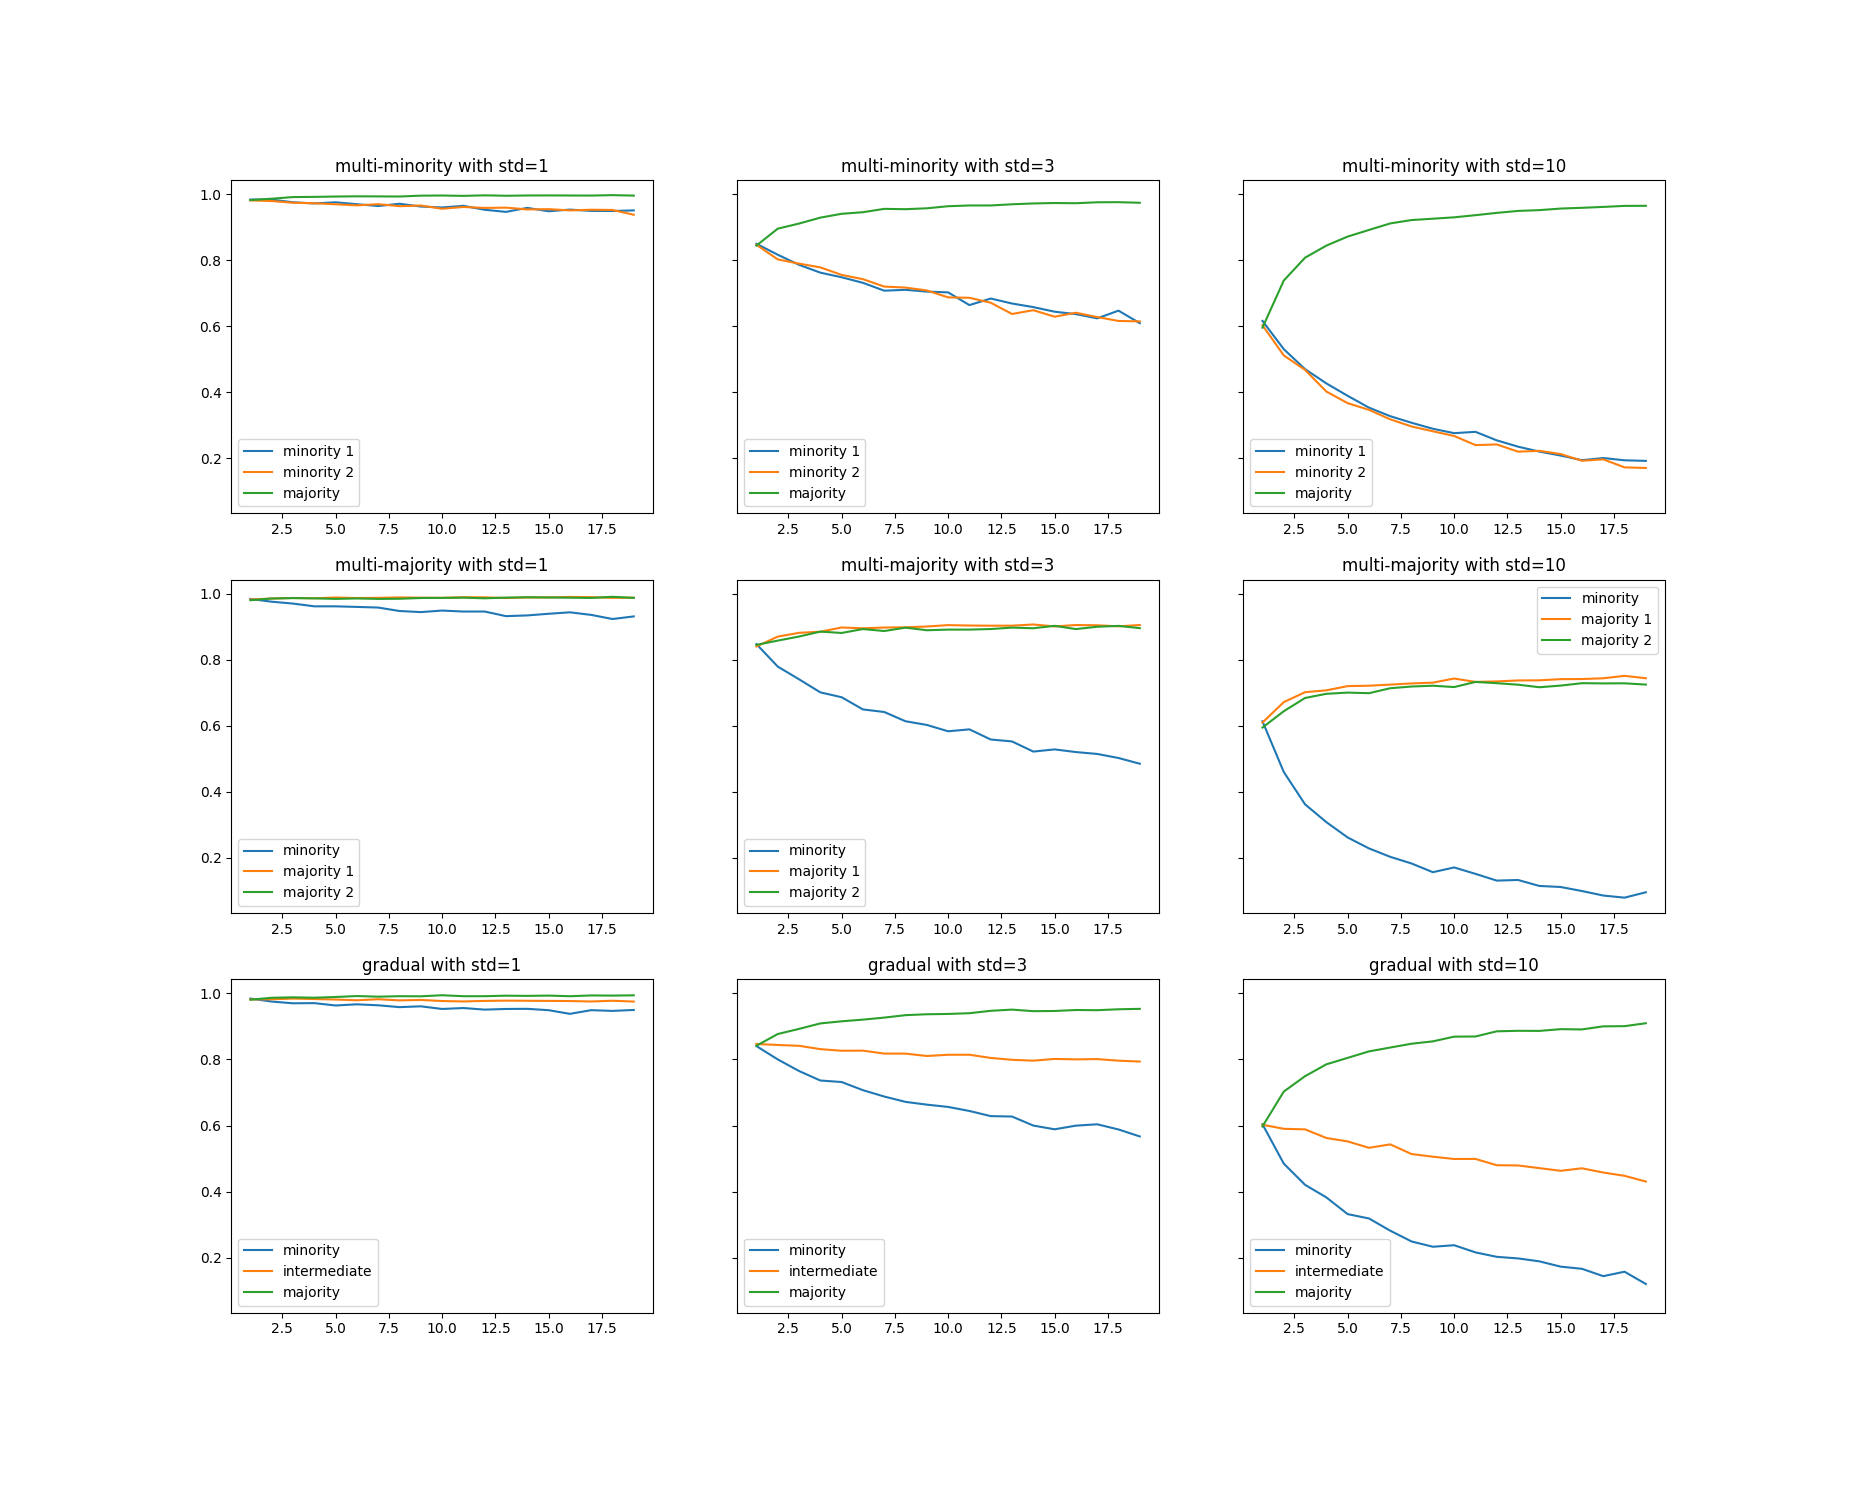
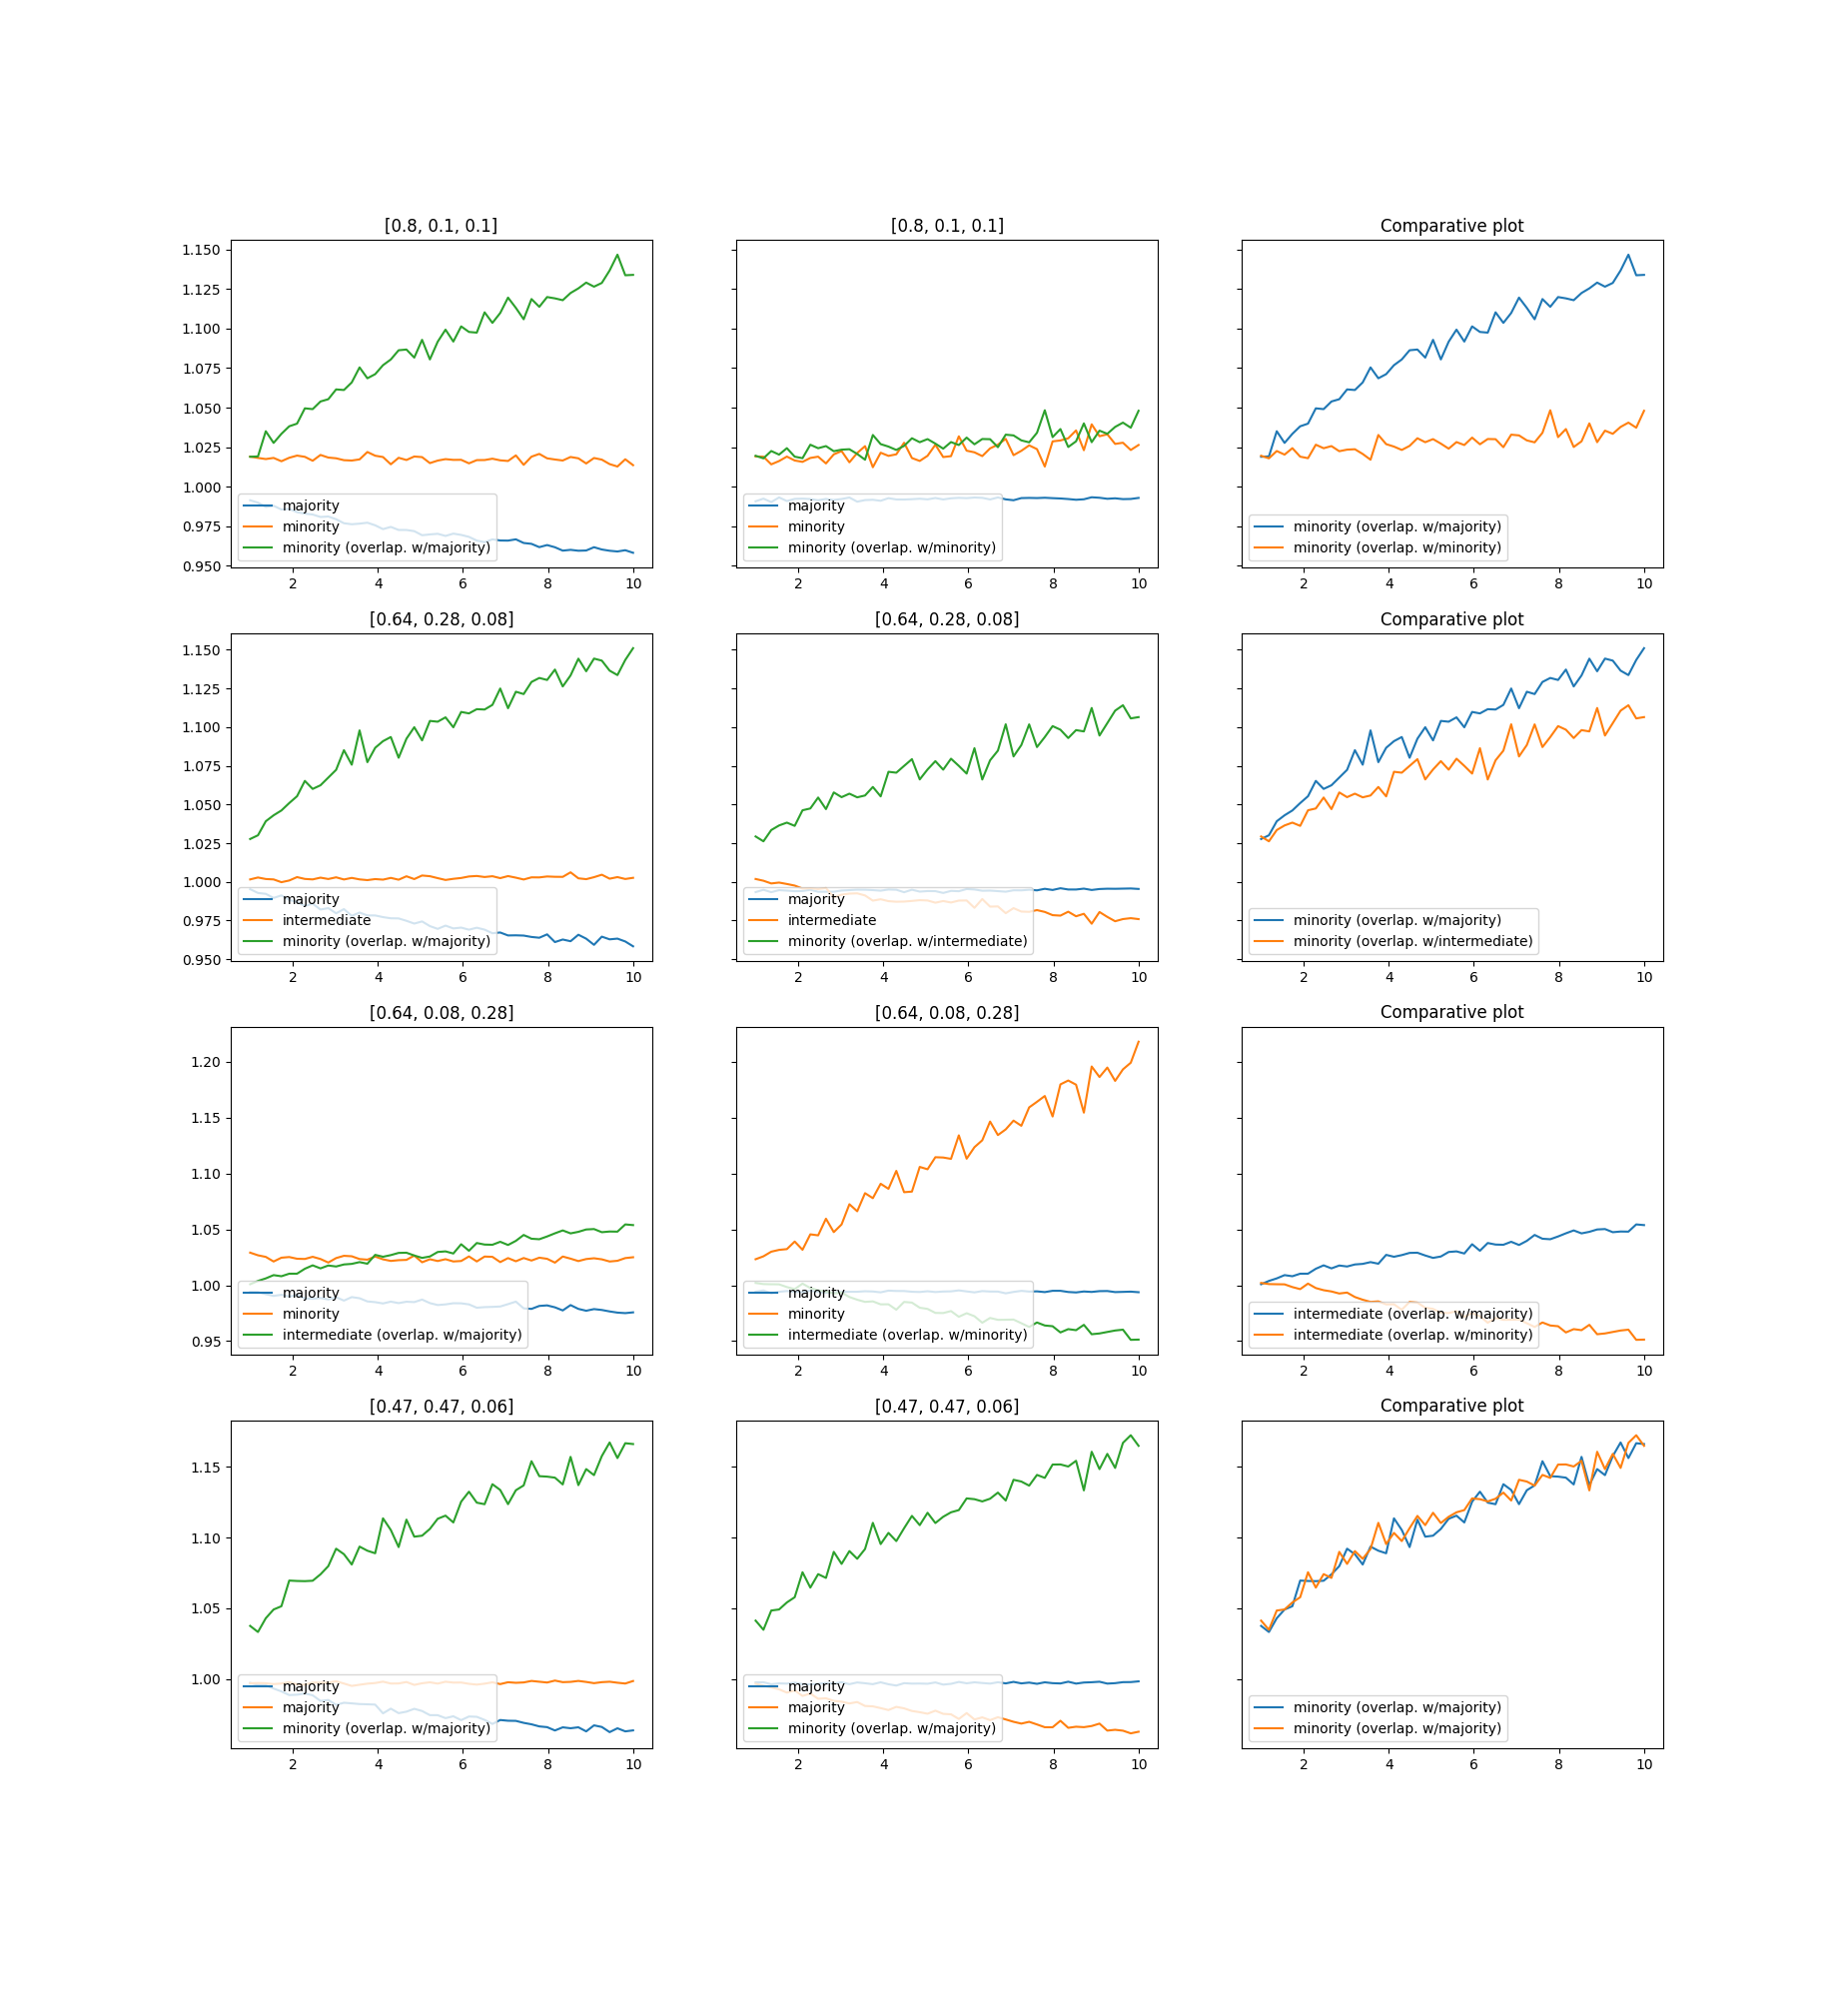
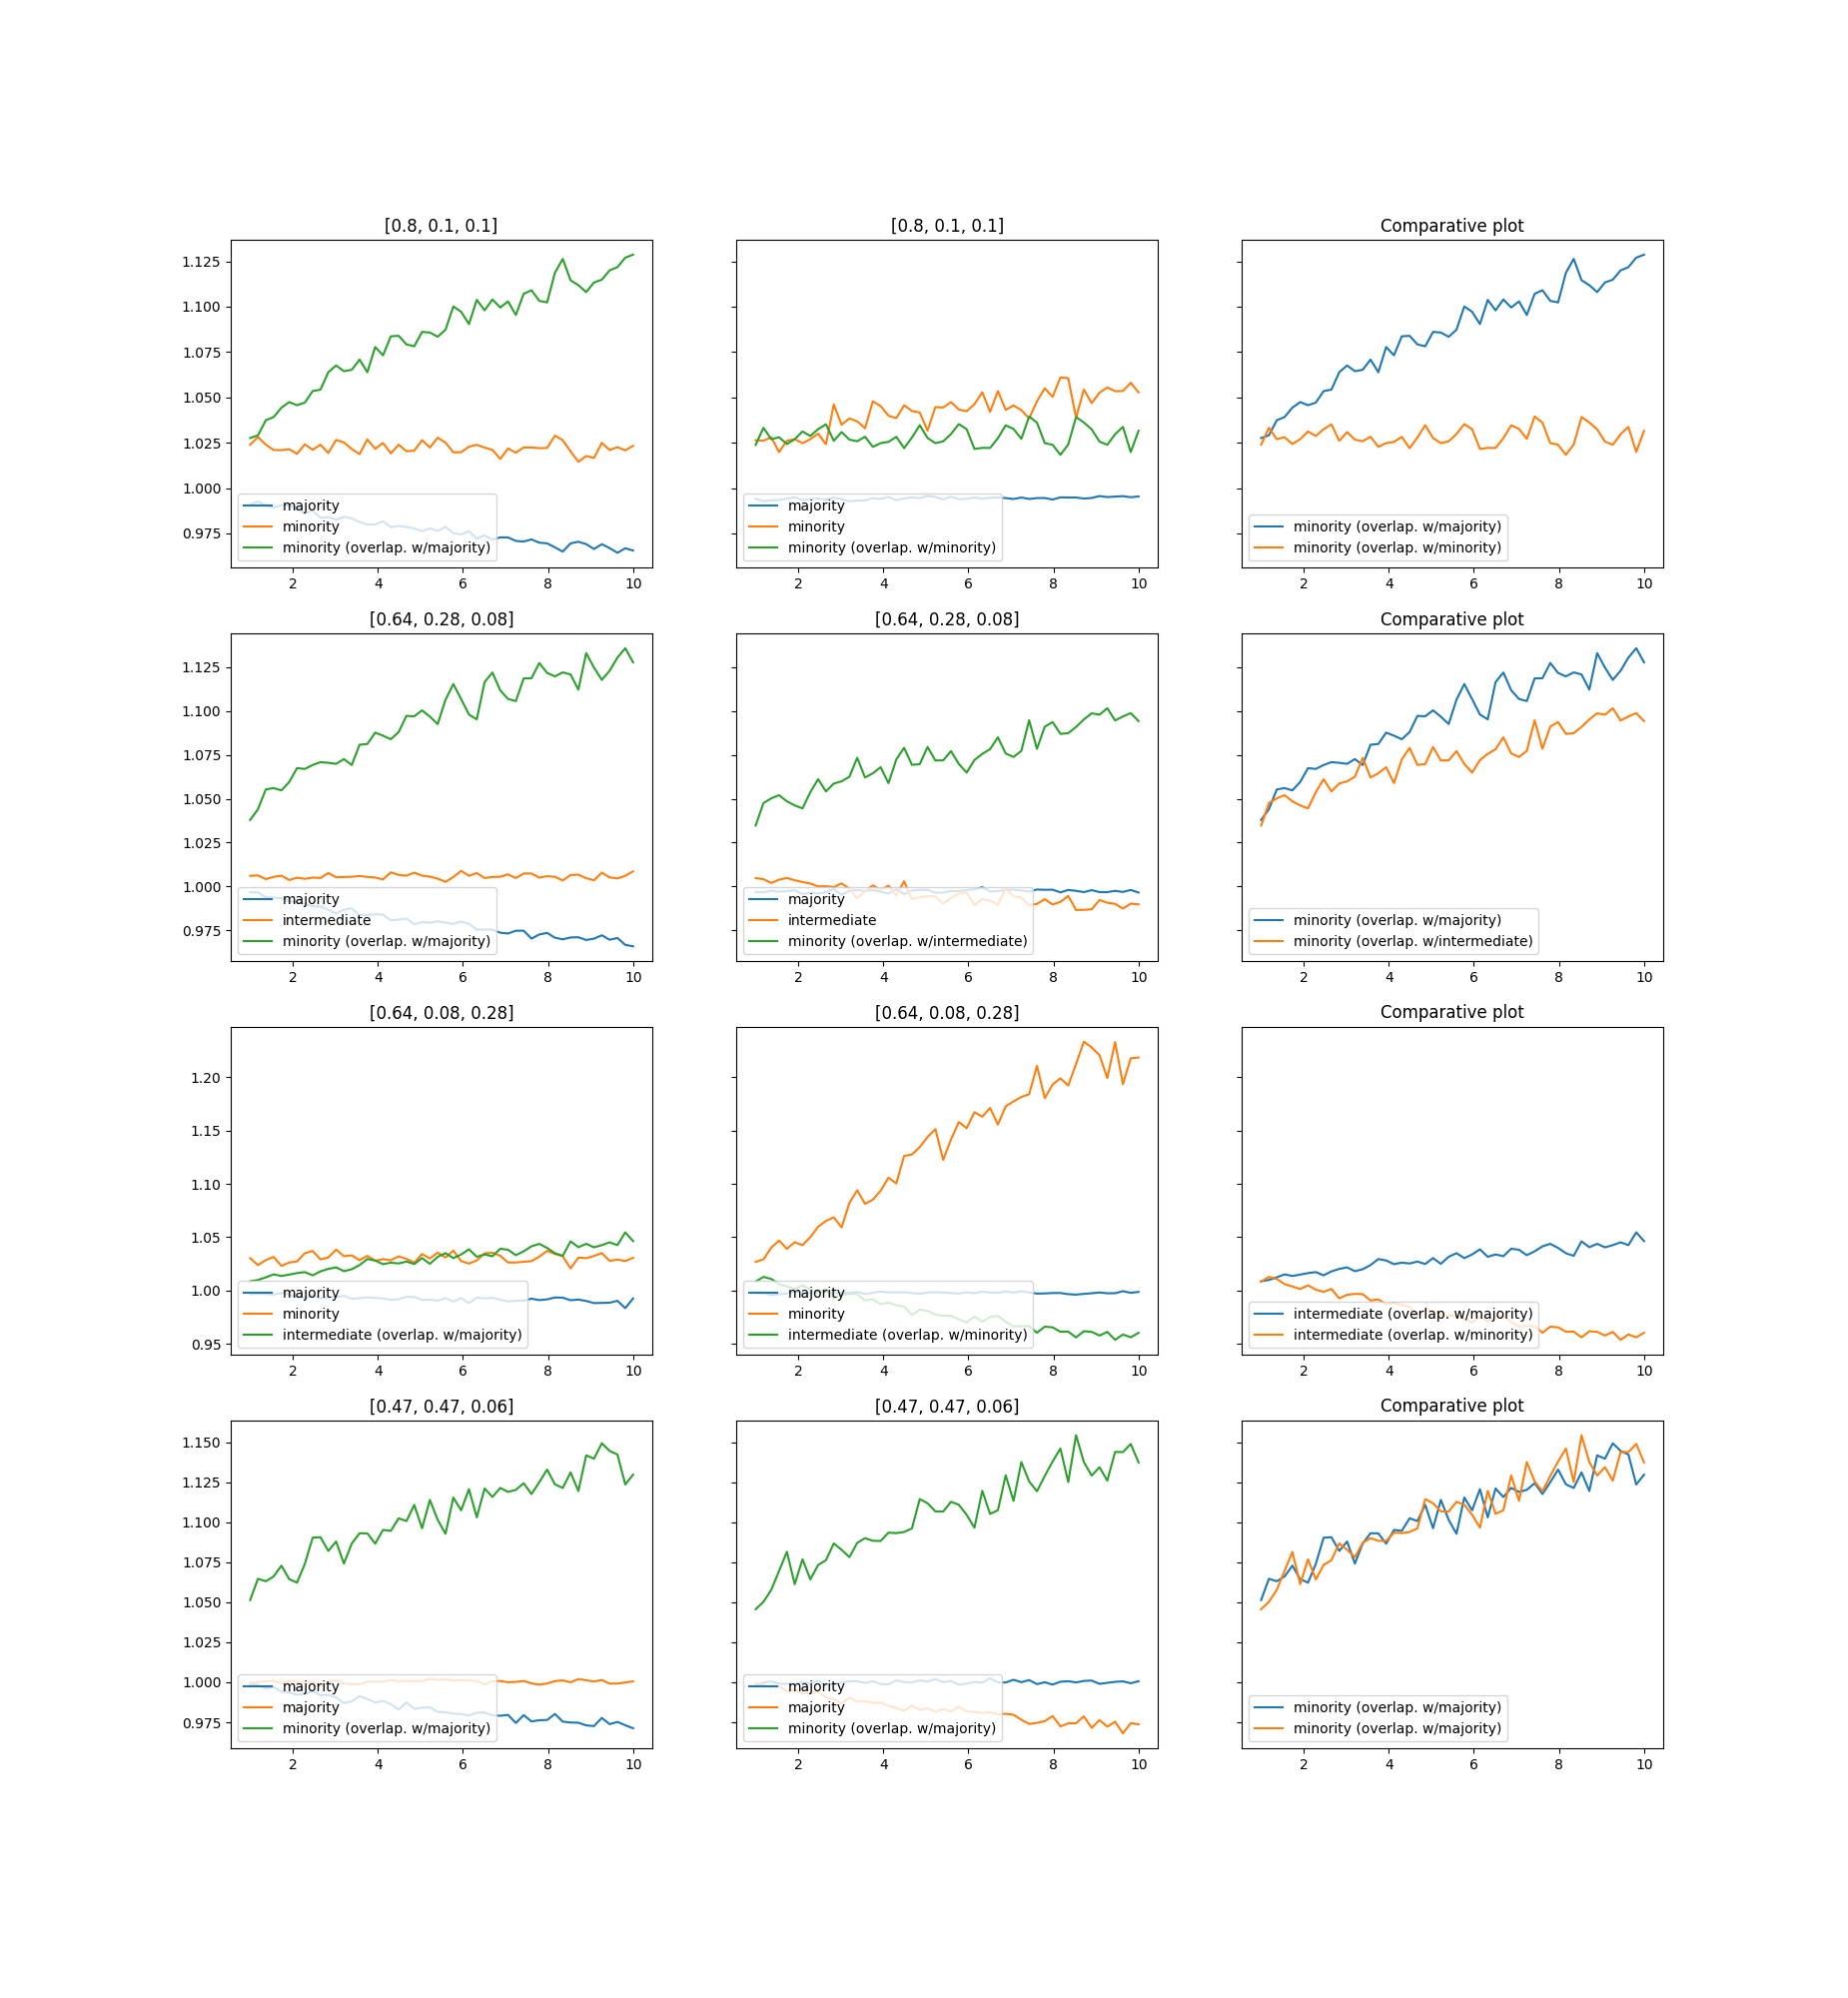
Results of Recalls on the traingle datasets (IR=8), where the class overlap was increased only with the selected class. Each row presents the results for one dataset configuration (the class cardinalities distribution is indicated in the plot title). First two plots in each row (form the left) shows class recalls when the selected class (green line) was overlapped with one of two other classes. The third plot (the right column) shows comparison of green lines from the first two plots for the selected class.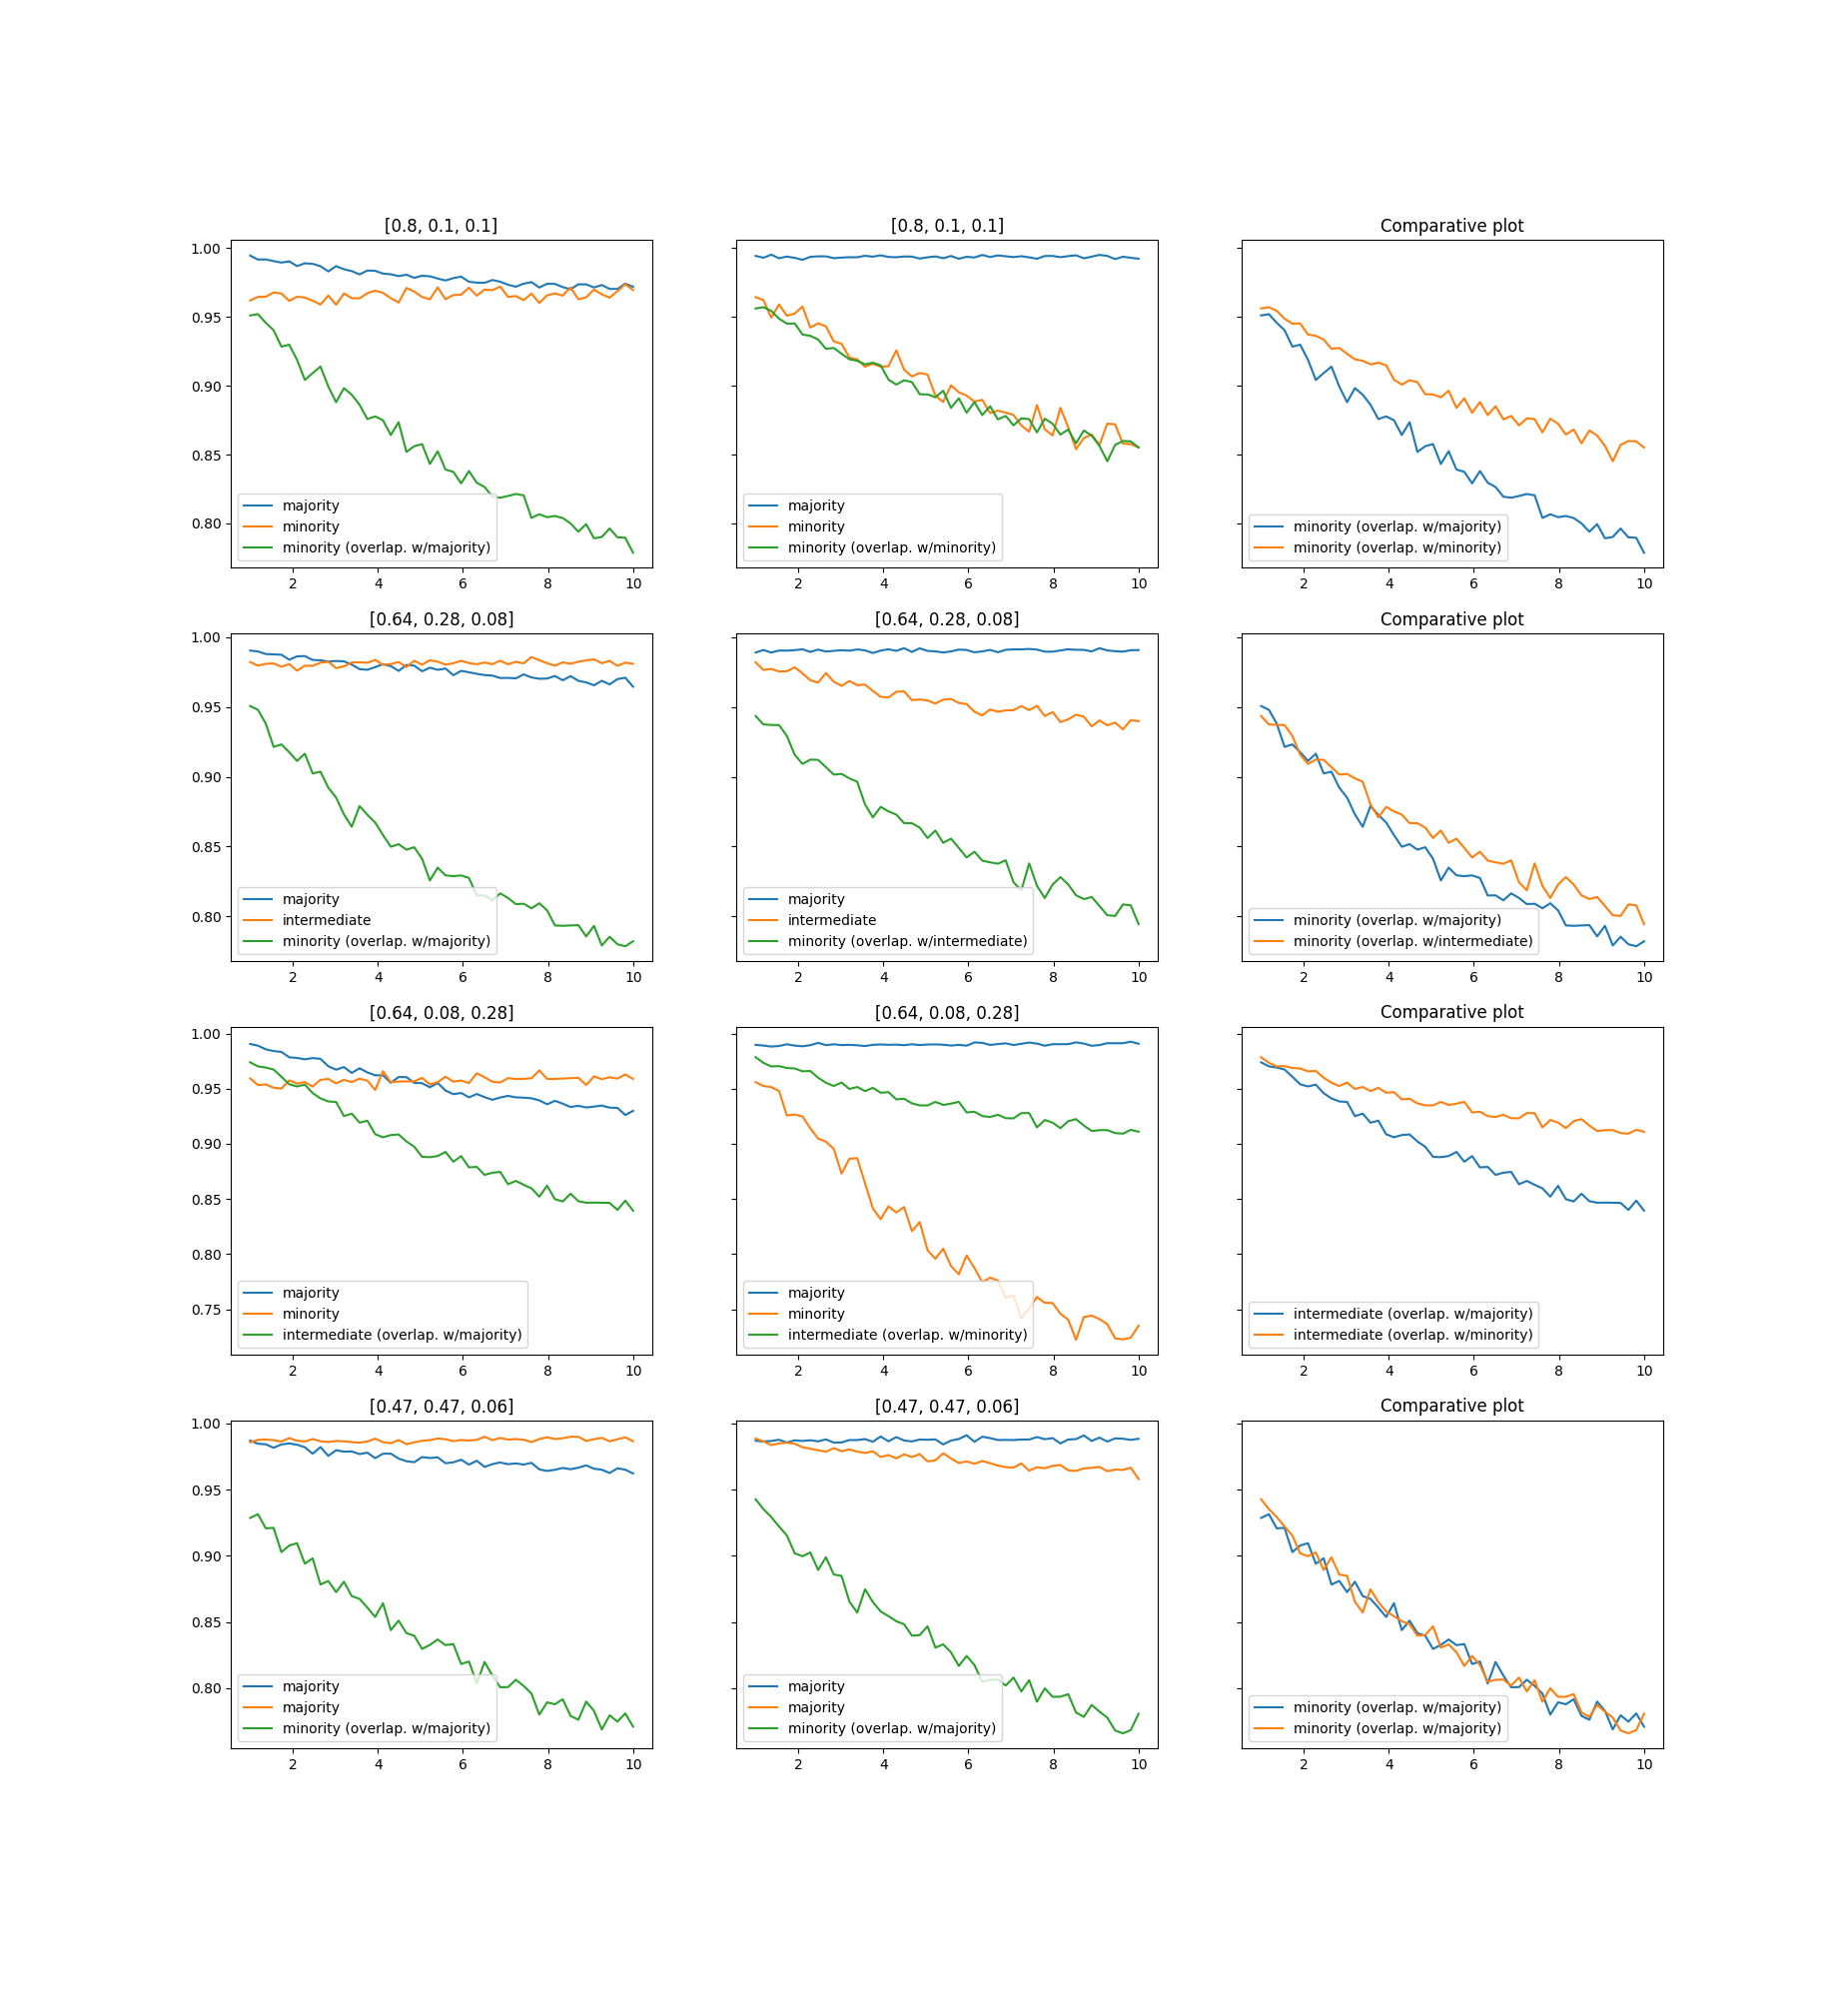 Results of OC Ratio on the traingle datasets (IR=8), where the class overlap was increased only with the selected class.
Each row presents the results for one dataset configuration (the class cardinalities distribution is indicated in the plot title). First
two plots in each row (form the left) shows class recalls when the selected class (green line) was overlapped with one of two other
classes. The third plot (the right column) shows comparison of green lines from the first two plots for the selected class.
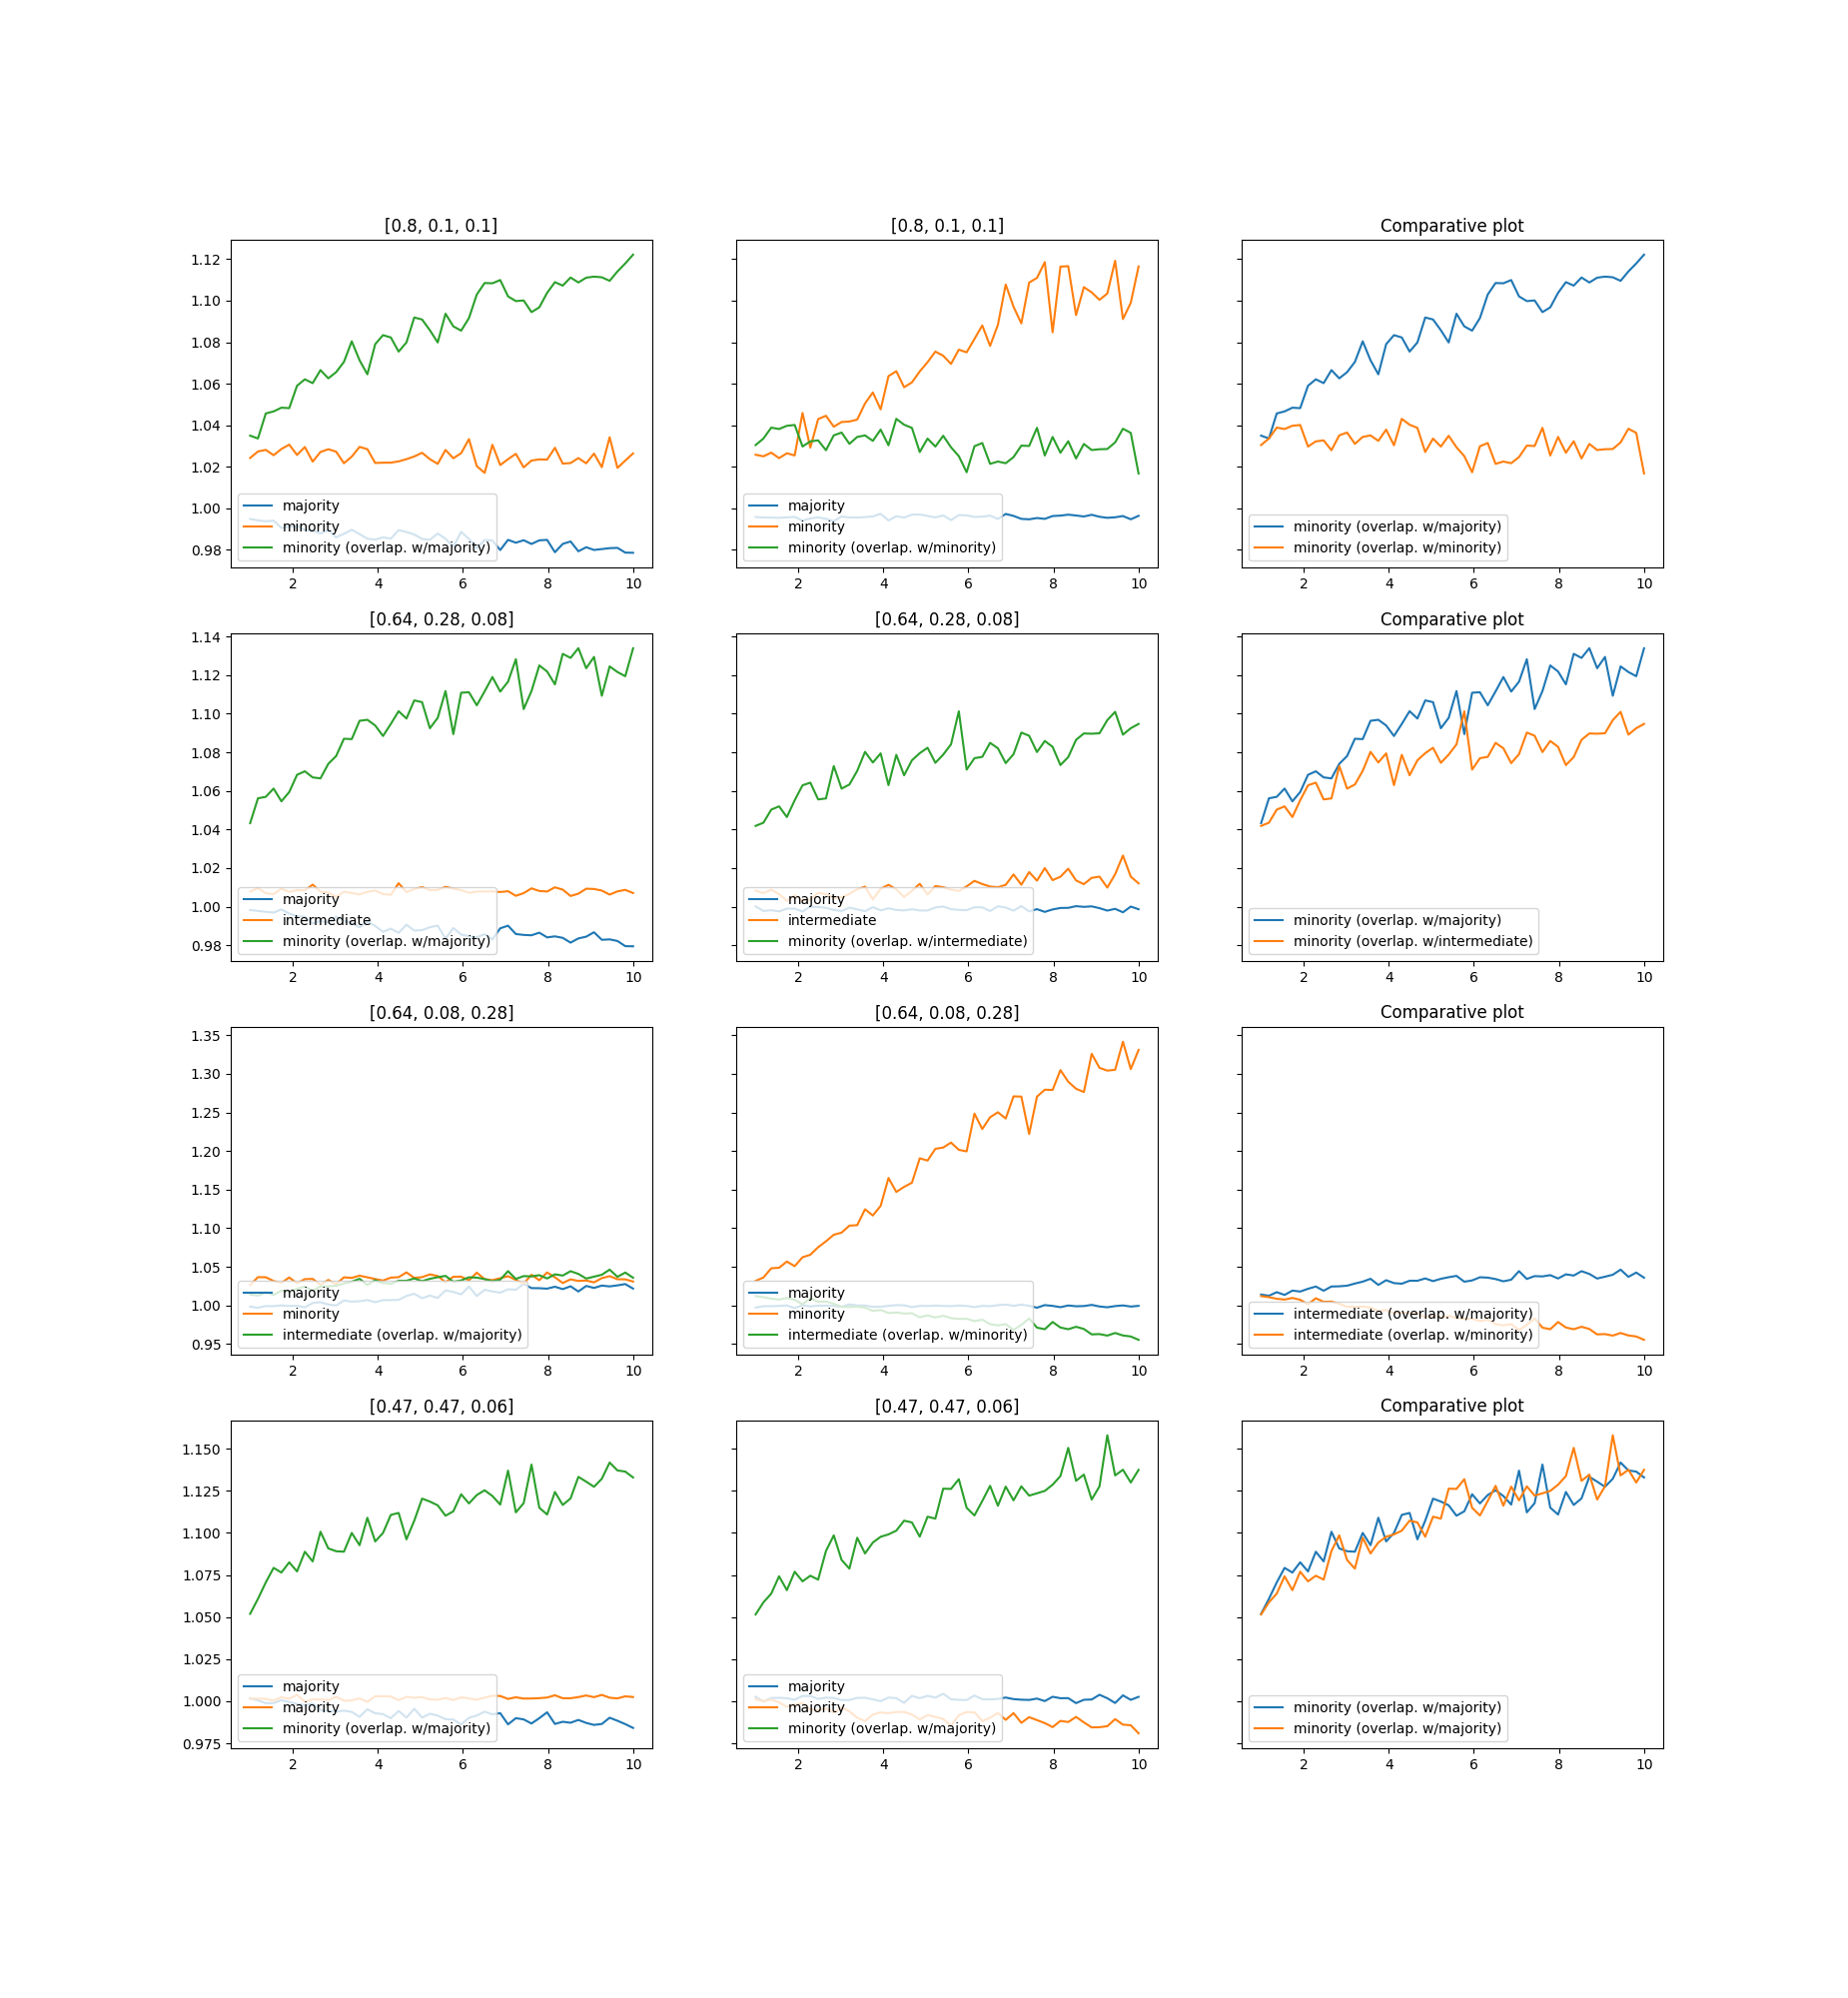
Results of OC Ratio on the traingle datasets (IR=8), where the class overlap was increased only with the selected class.
Each row presents the results for one dataset configuration (the class cardinalities distribution is indicated in the plot title). First
two plots in each row (form the left) shows class recalls when the selected class (green line) was overlapped with one of two other
classes. The third plot (the right column) shows comparison of green lines from the first two plots for the selected class.
3.2 K-nearest neighbors
Results of Recalls on the traingle datasets (IR=8), where the class overlap was increased only with the selected class. Each row presents the results for one dataset configuration (the class cardinalities distribution is indicated in the plot title). First two plots in each row (form the left) shows class recalls when the selected class (green line) was overlapped with one of two other classes. The third plot (the right column) shows comparison of green lines from the first two plots for the selected class.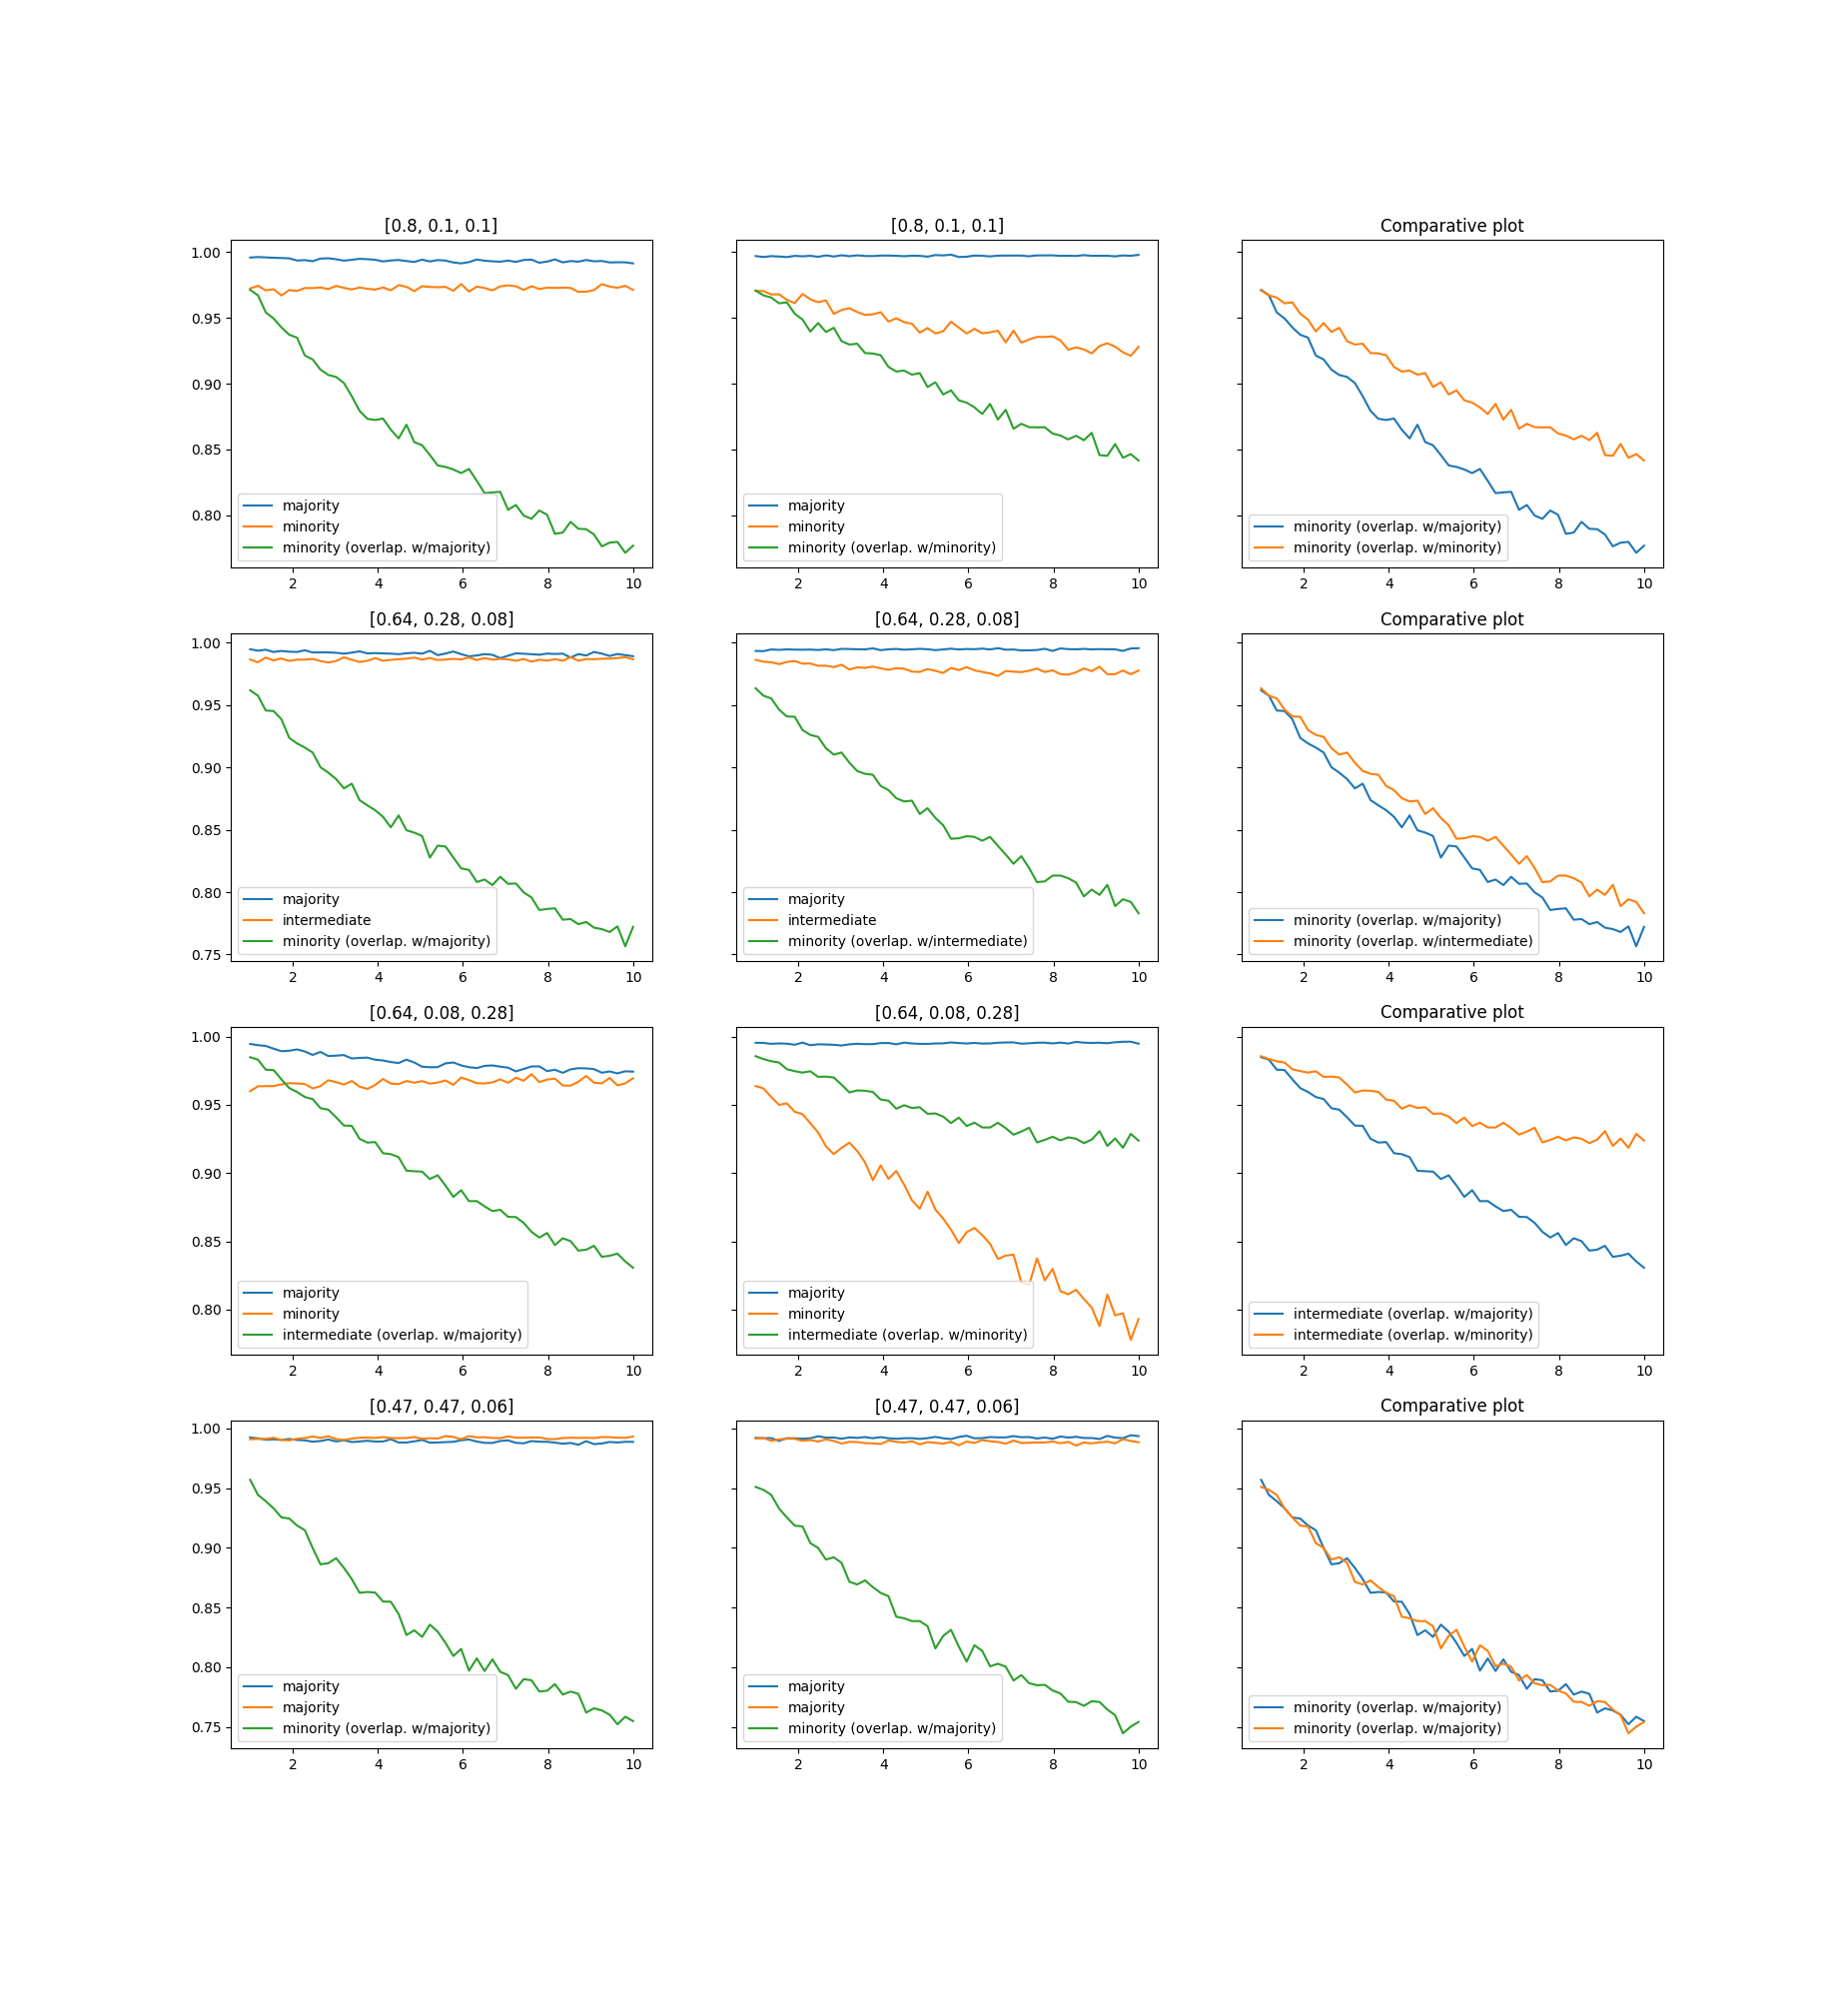 Results of OC Ratio on the traingle datasets (IR=8), where the class overlap was increased only with the selected class.
Each row presents the results for one dataset configuration (the class cardinalities distribution is indicated in the plot title). First
two plots in each row (form the left) shows class recalls when the selected class (green line) was overlapped with one of two other
classes. The third plot (the right column) shows comparison of green lines from the first two plots for the selected class.
Results of OC Ratio on the traingle datasets (IR=8), where the class overlap was increased only with the selected class.
Each row presents the results for one dataset configuration (the class cardinalities distribution is indicated in the plot title). First
two plots in each row (form the left) shows class recalls when the selected class (green line) was overlapped with one of two other
classes. The third plot (the right column) shows comparison of green lines from the first two plots for the selected class.
3.3 Bagging with 30 decision trees
Results of Recalls on the traingle datasets (IR=8), where the class overlap was increased only with the selected class. Each row presents the results for one dataset configuration (the class cardinalities distribution is indicated in the plot title). First two plots in each row (form the left) shows class recalls when the selected class (green line) was overlapped with one of two other classes. The third plot (the right column) shows comparison of green lines from the first two plots for the selected class.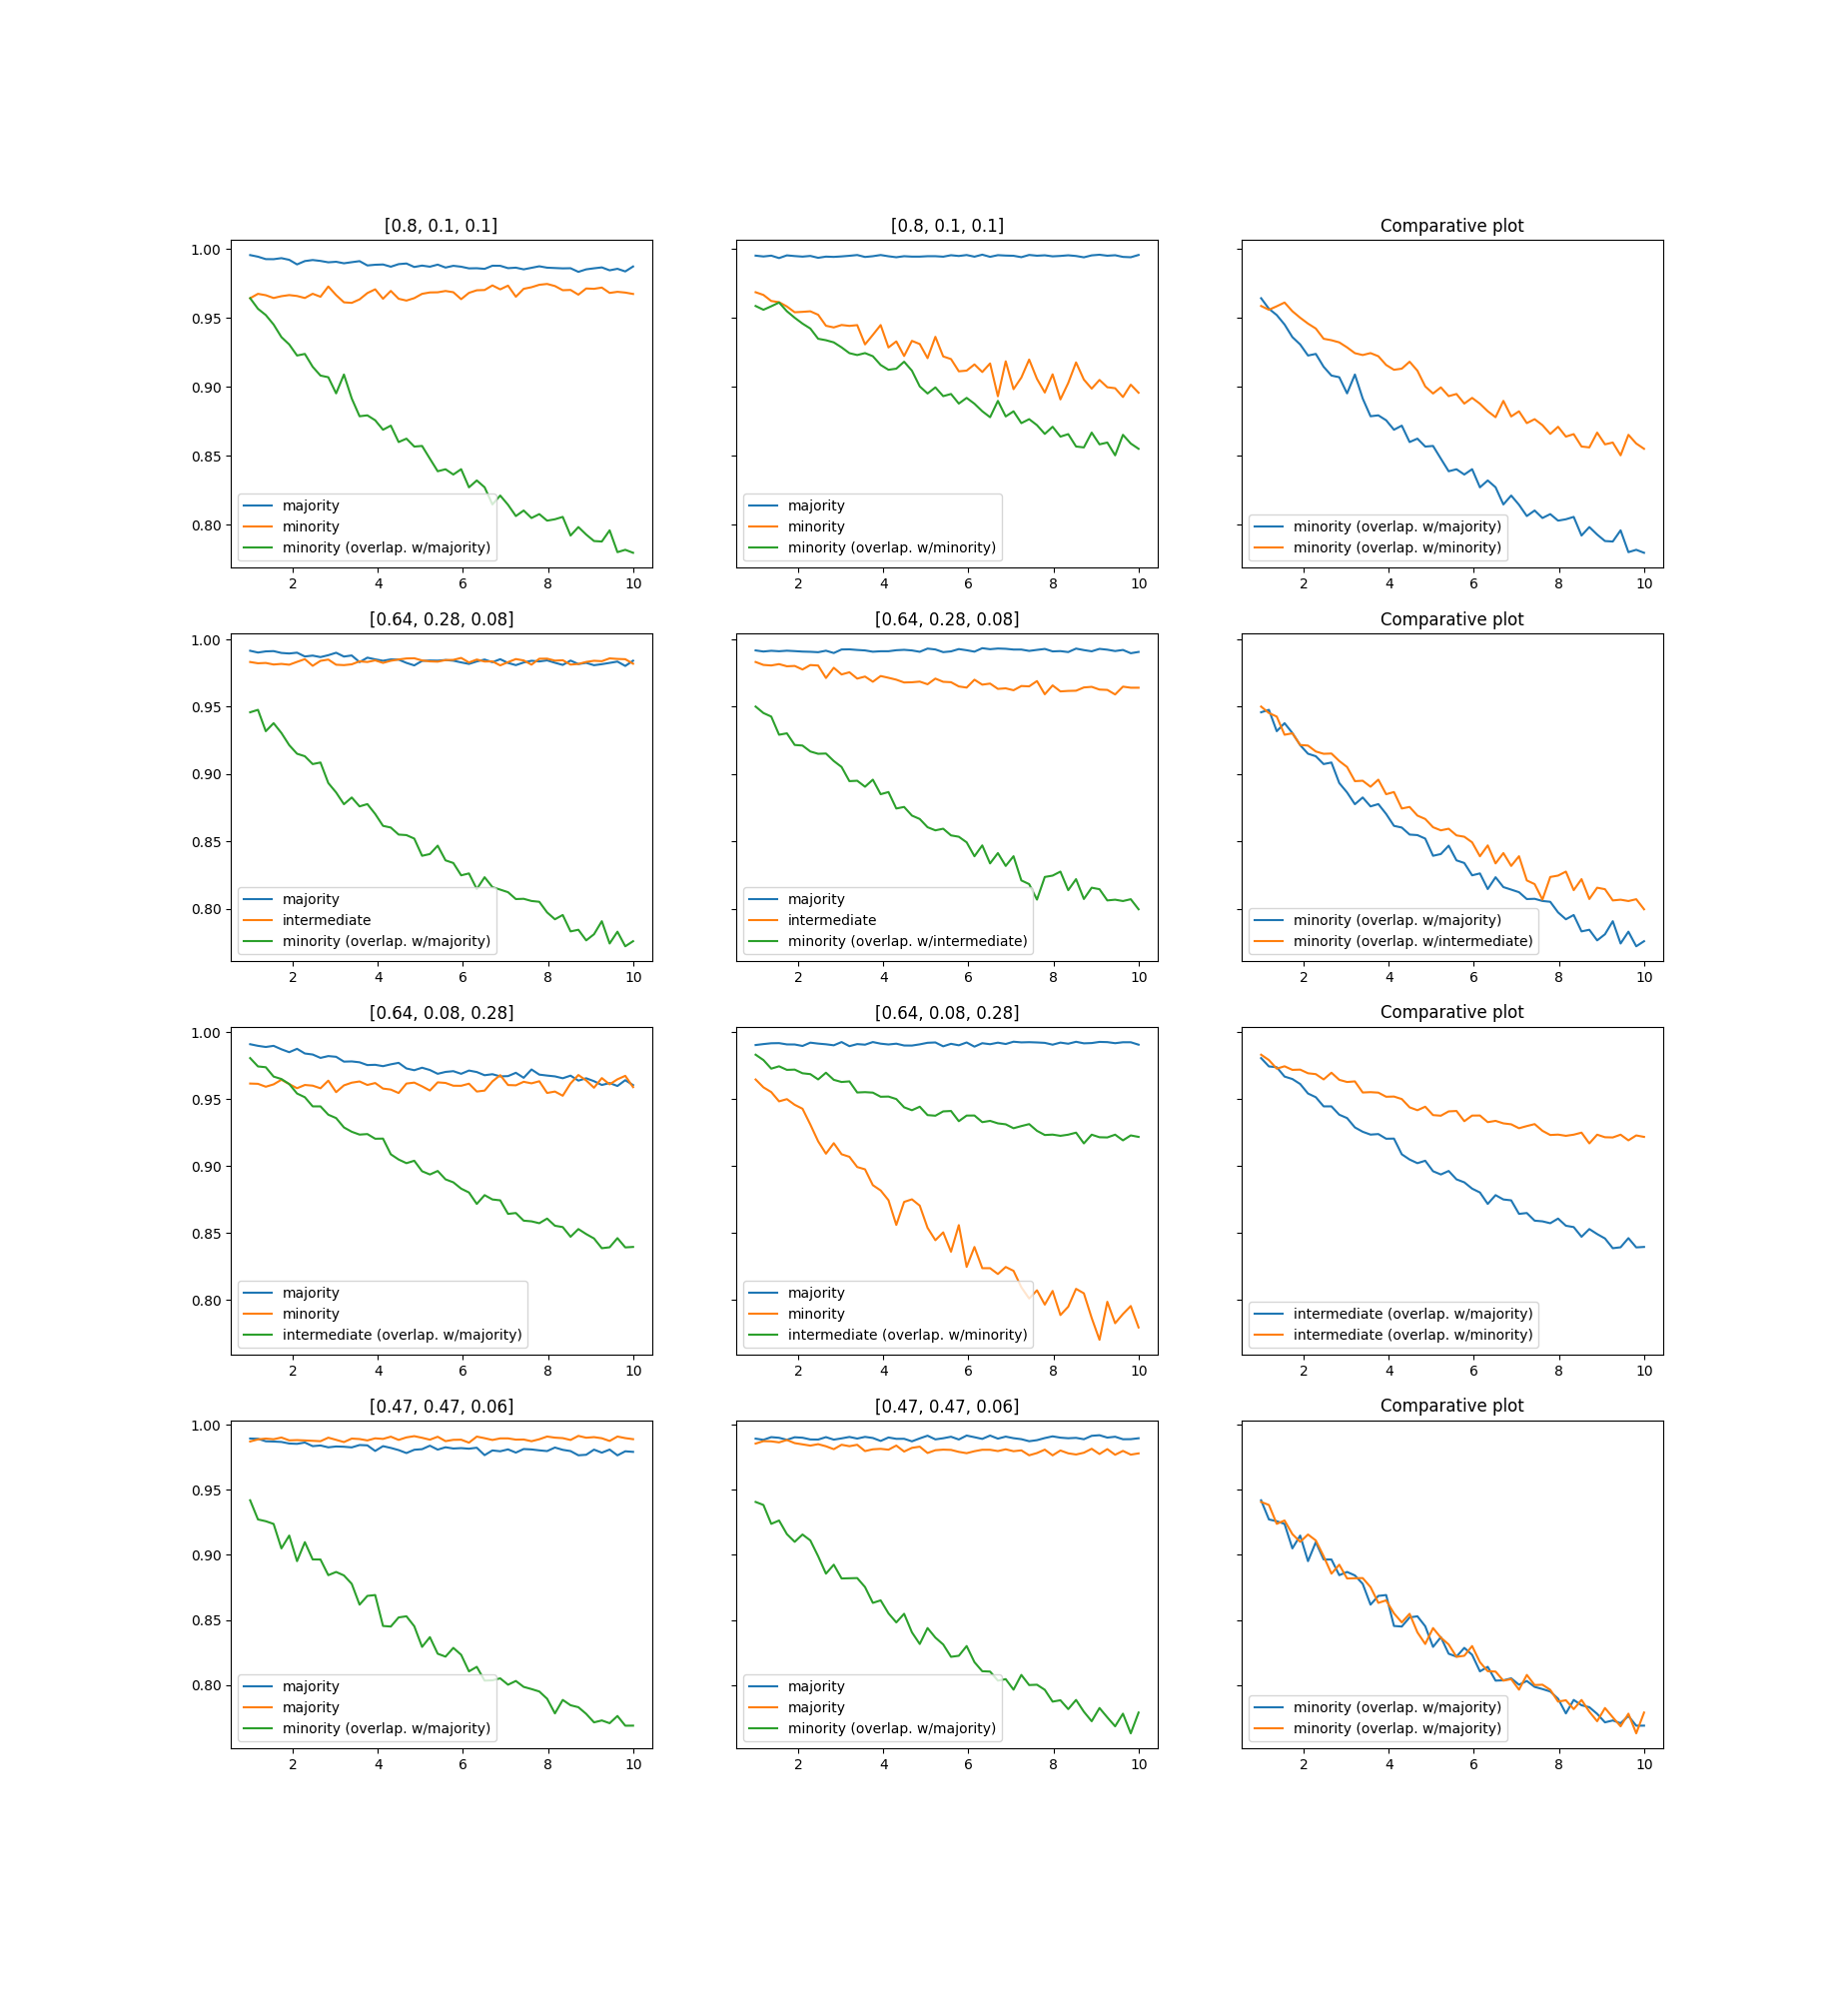 Results of OC Ratio on the traingle datasets (IR=8), where the class overlap was increased only with the selected class.
Each row presents the results for one dataset configuration (the class cardinalities distribution is indicated in the plot title). First
two plots in each row (form the left) shows class recalls when the selected class (green line) was overlapped with one of two other
classes. The third plot (the right column) shows comparison of green lines from the first two plots for the selected class.
Results of OC Ratio on the traingle datasets (IR=8), where the class overlap was increased only with the selected class.
Each row presents the results for one dataset configuration (the class cardinalities distribution is indicated in the plot title). First
two plots in each row (form the left) shows class recalls when the selected class (green line) was overlapped with one of two other
classes. The third plot (the right column) shows comparison of green lines from the first two plots for the selected class.
4 Increasing the number of classes
4.1 Decision Tree
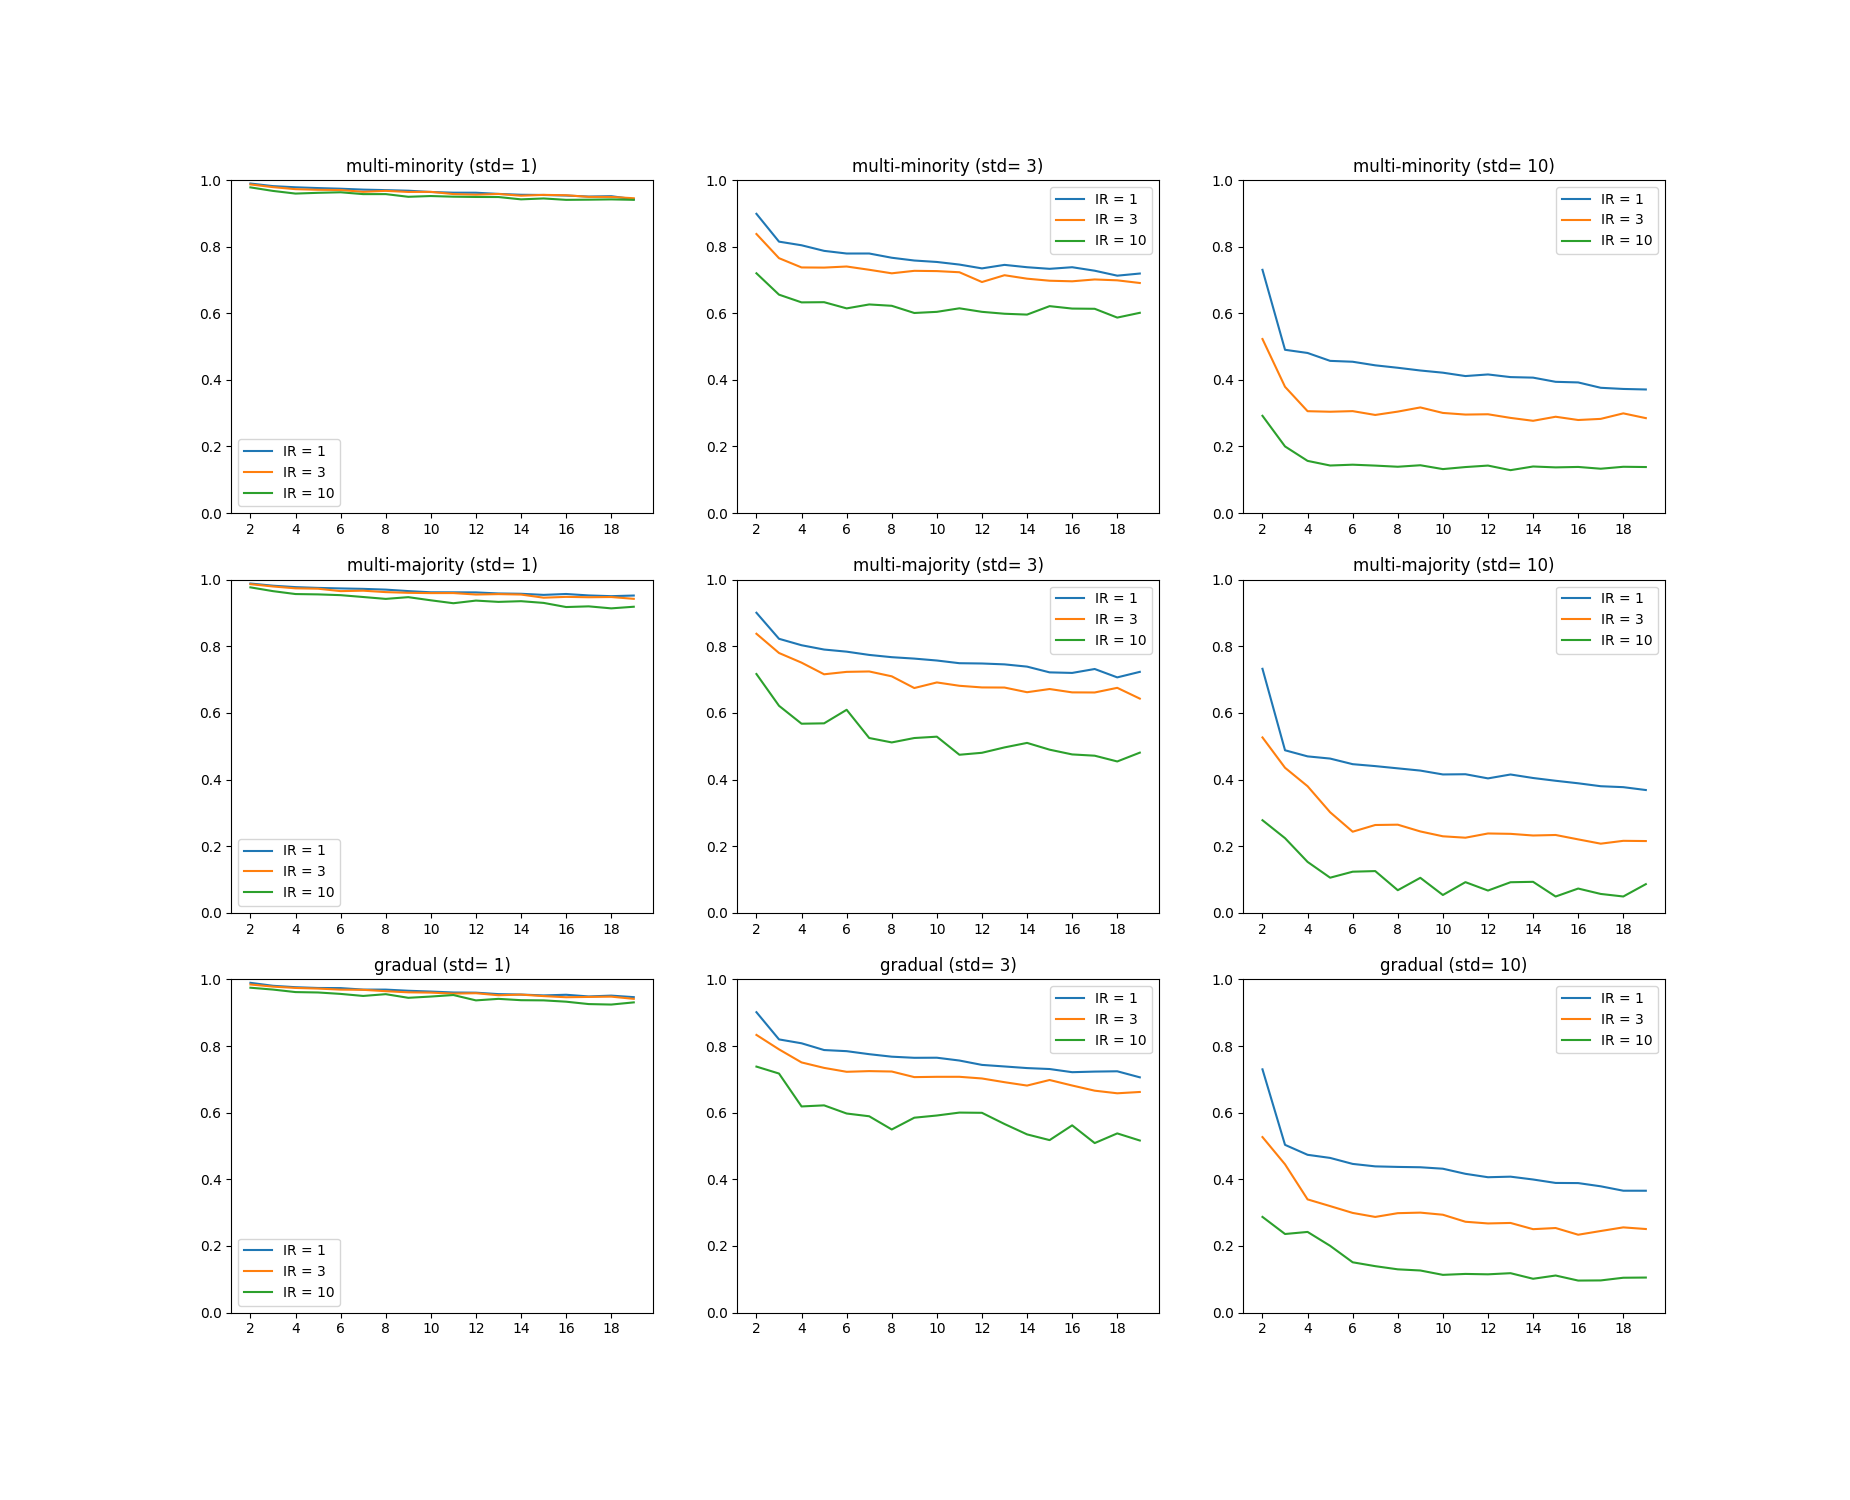
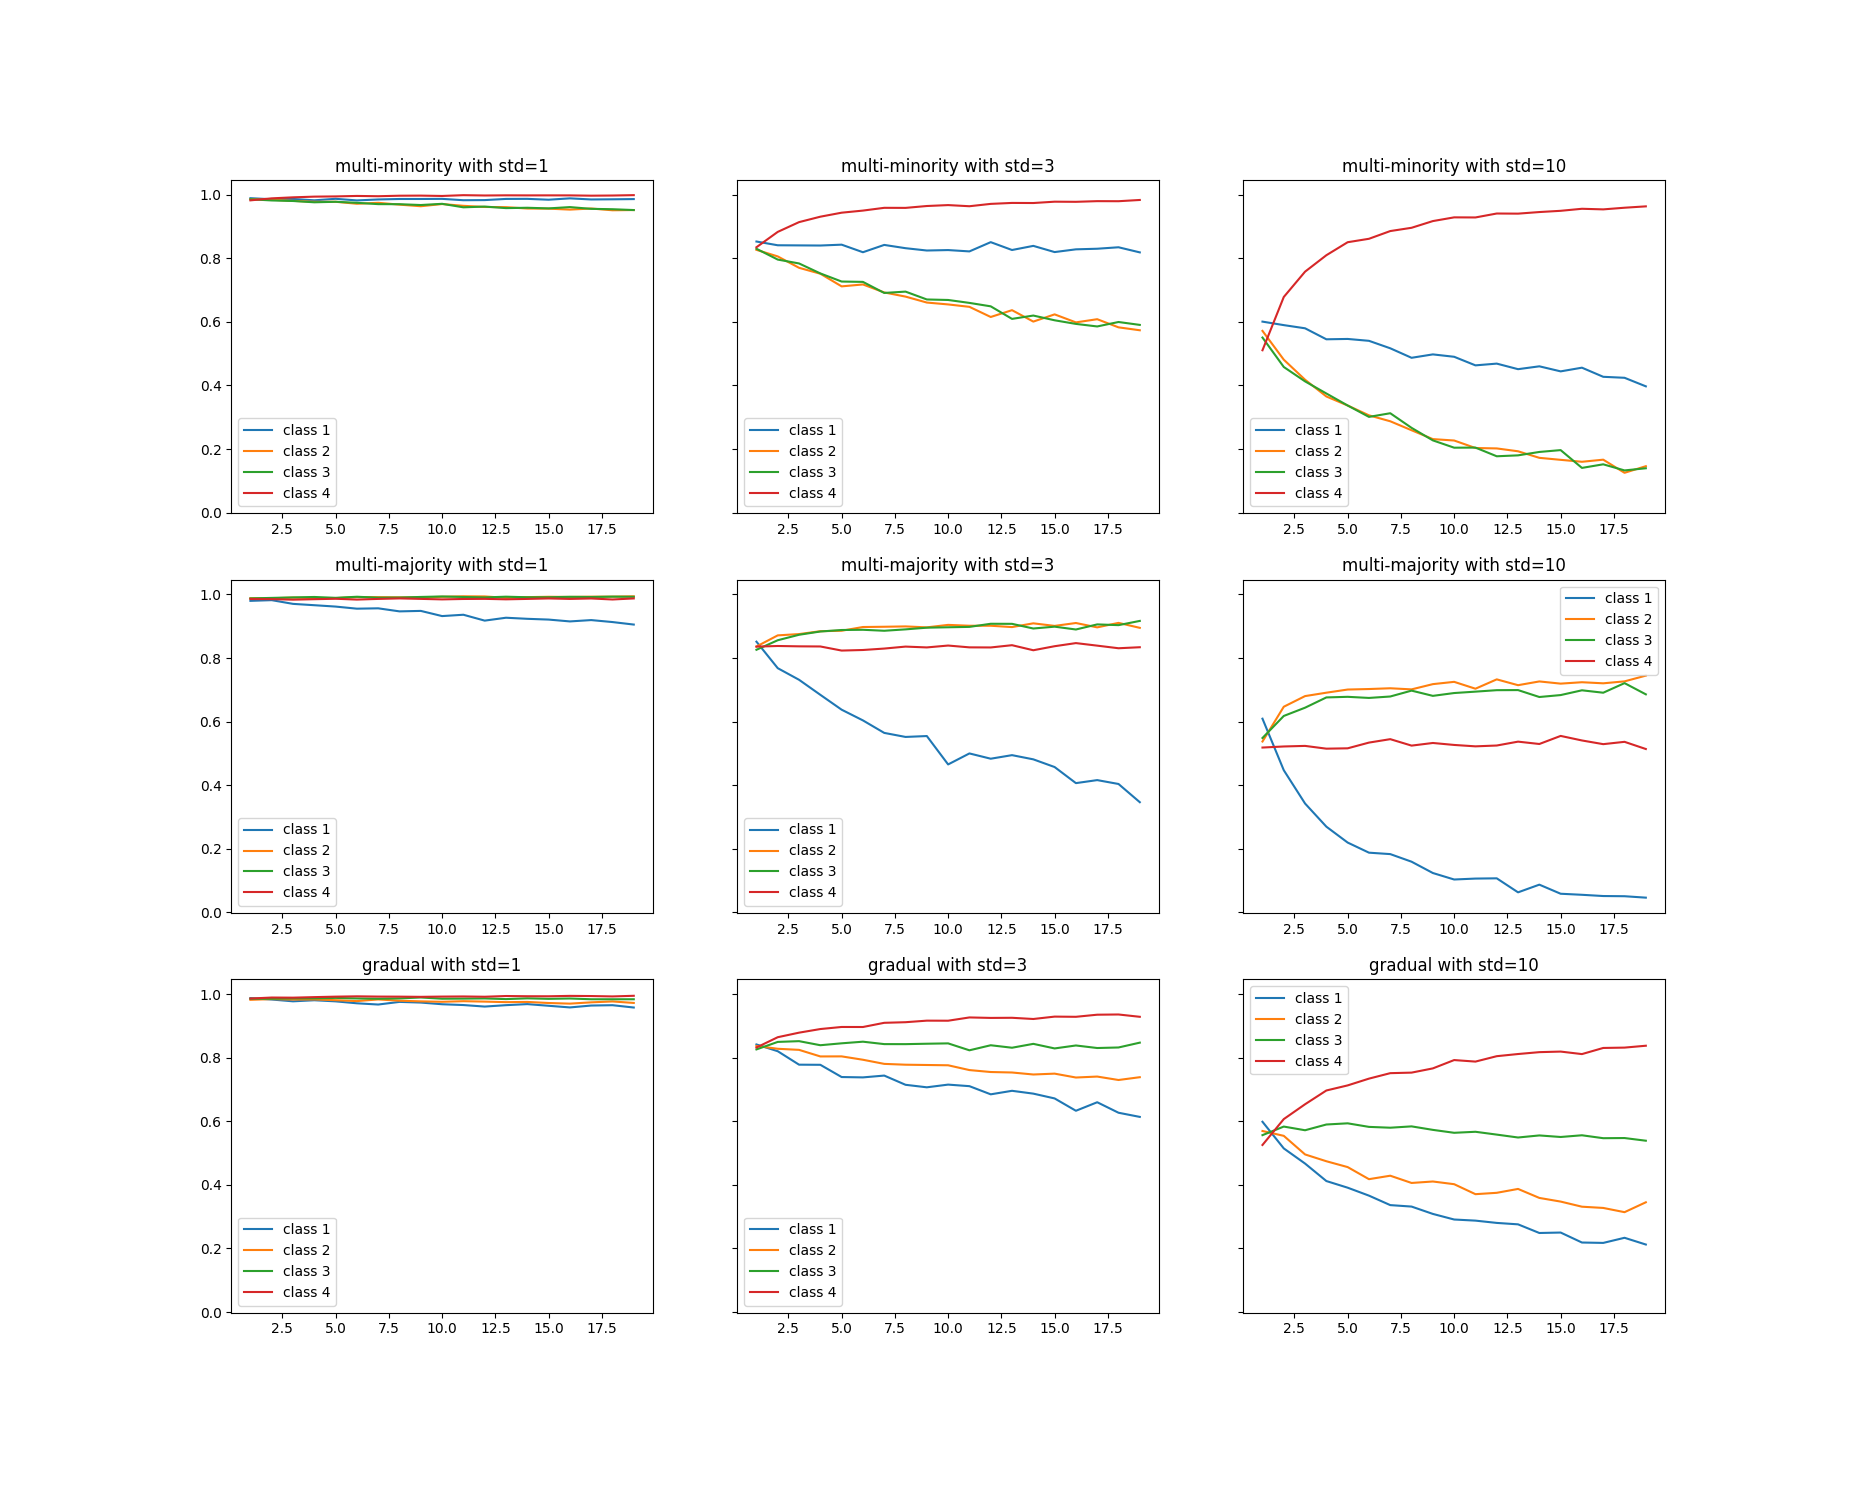
The recall of the worst recognized class vs. the number of classes in the dataset for the tree classifier. Each row presents the results for datasets with different type of class size configuration (multi-minority, multi-majority and gradual), whereas each column presents results for datasets with different level of class overlapping (no-overlapping - std=1, moderate overlapping - std = 3 and strong overlapping - std=10).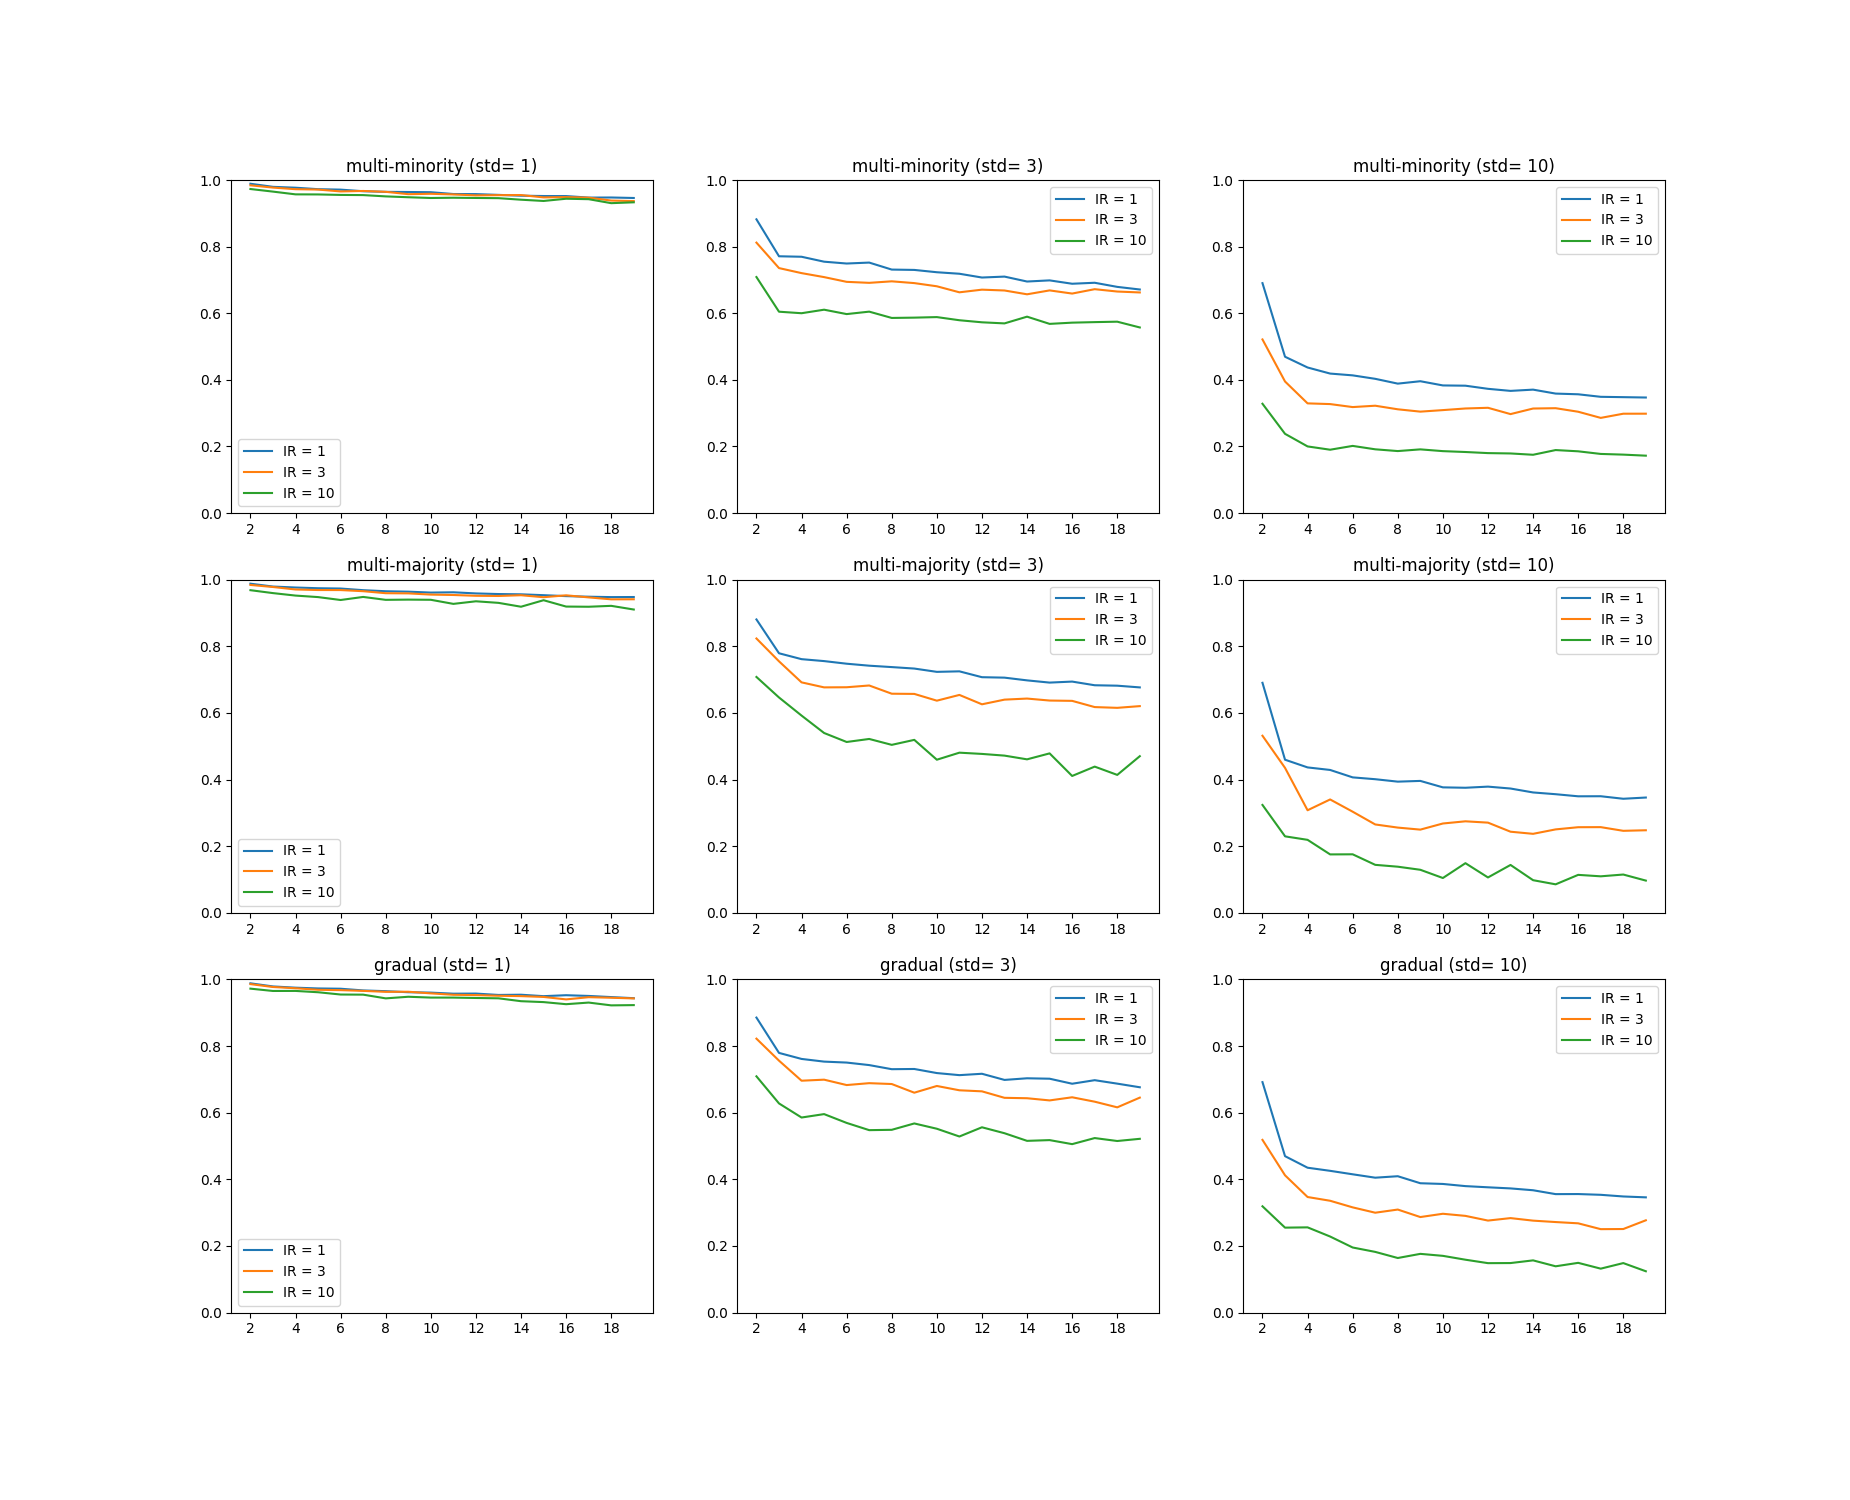
4.2 K-nearest neighbors
The recall of the worst recognized class vs. the number of classes in the dataset for the tree classifier. Each row presents the results for datasets with different type of class size configuration (multi-minority, multi-majority and gradual), whereas each column presents results for datasets with different level of class overlapping (no-overlapping - std=1, moderate overlapping - std = 3 and strong overlapping - std=10).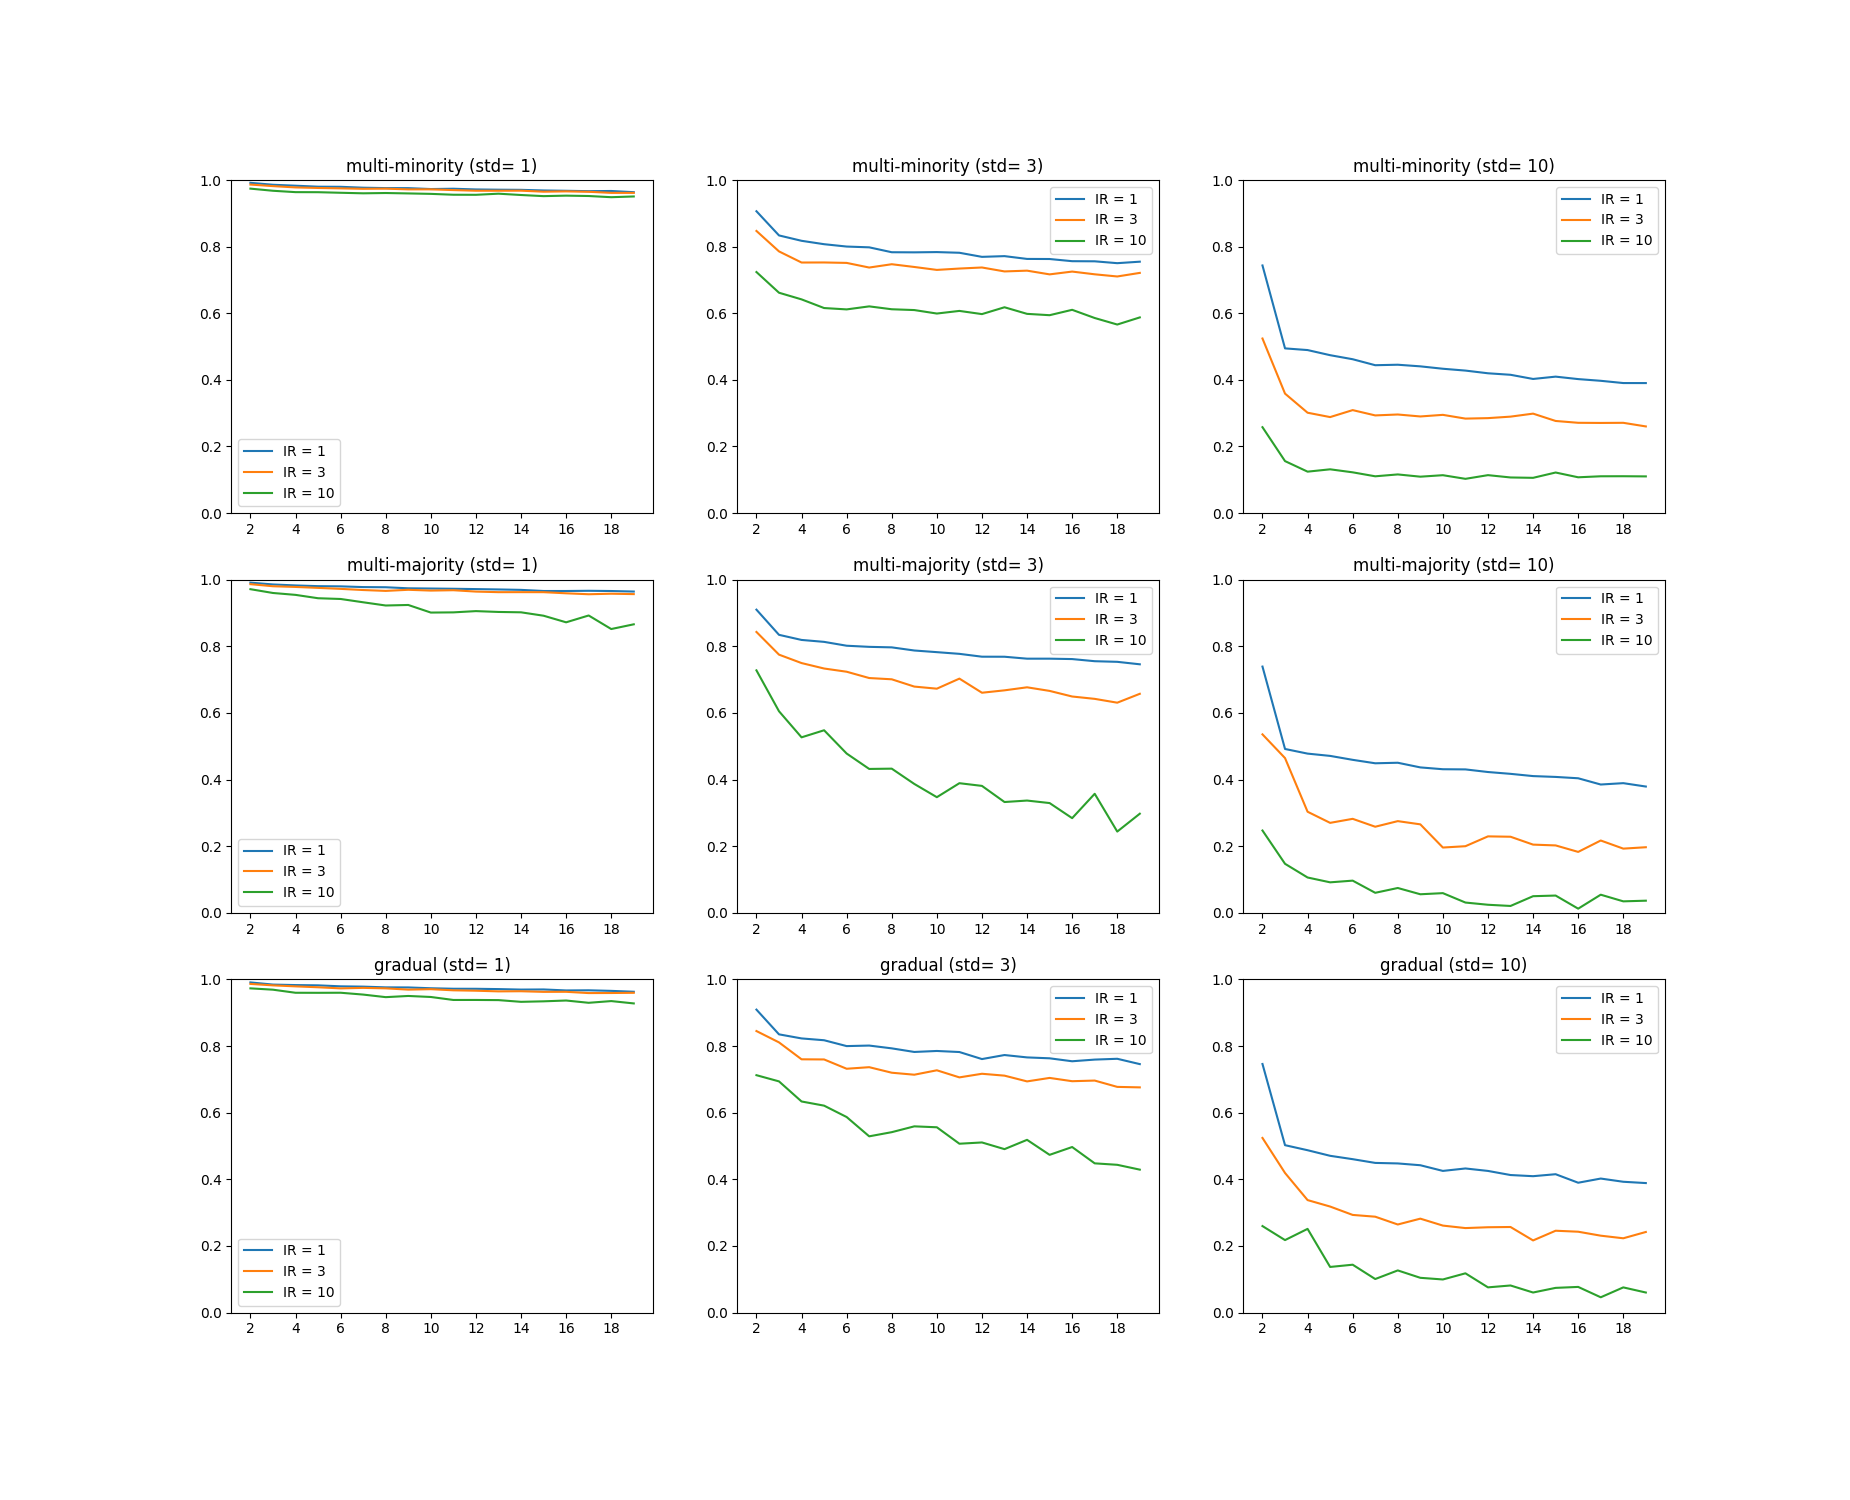
4.3 Bagging with 30 decision trees
The recall of the worst recognized class vs. the number of classes in the dataset for the tree classifier. Each row presents the results for datasets with different type of class size configuration (multi-minority, multi-majority and gradual), whereas each column presents results for datasets with different level of class overlapping (no-overlapping - std=1, moderate overlapping - std = 3 and strong overlapping - std=10).