In [1]:
%matplotlib inline
from ipywidgets import *
import matplotlib.pyplot as plt
from IPython.display import set_matplotlib_formats
set_matplotlib_formats('svg')
import numpy as np
import scipy.stats as stats
In [2]:
def corr_plot(slope=1, sd=0, typ='kowariancja', show=False):
    x = np.linspace(0, 10, 100)
    y = slope * x + np.random.normal(0,sd,100)
    fig, axes = plt.subplots(figsize=(6,6))
    plt.scatter(x, y)
    c = np.corrcoef(x, y)[0][1] if typ=="korelacja" else np.cov(x,y)[0][1]
    c = round(c,3)
    title = "c="+str(c) if typ=='kowariancja' else "r="+str(c)
    if show:
        plt.title(title)
    plt.xlim(0,10)
    plt.ylim(-10,10)

def corr_examples(example="1", typ='kowariancja', show=False):
    x = np.linspace(1, 10, 100)
    y = -x**3 + np.random.normal(0,100,100) if example=="1" else np.cos(x) + np.random.normal(0,0.1,100)
    plt.scatter(x, y)
    if show:
        if typ=="korelacja":
            plt.title("r="+str(round(np.corrcoef(x, y)[0][1],3)))
        else:
            plt.title("c="+str(round(np.cov(x, y)[0][1],3)))
Korelacja i regresja liniowa
Kowariancja
- Kowariancja zmiennych losowych
- Estymator kowariancji
Przykład:
| X | Y |
|---|---|
| 1 | 5 |
| 2 | 6 |
| 3 | 1 |
mx = 2
my = 4
((1-2)(5-4)+(2-2)(6-4)+(3-2)(1-4))/2 = (-1+0-3)/2 = -2
In [3]:
interact(corr_plot, slope=(-1, 1, 0.1), sd=(0,10,1), typ=["kowariancja", "korelacja"])
Out[3]:
In [4]:
interact(corr_examples, typ=["kowariancja", "korelacja"], example=["1", "2"])
Out[4]:
- Kowariancja a niezależność zmiennych
$\;\;\;\;\;E[(X-\mu_x)(Y-\mu_y)] = E[XY - X\mu_Y-Y\mu_X+\mu_X\mu_Y]=E[XY]-E[X\mu_Y]-E[Y\mu_X]+\mu_X\mu_Y=E[XY]-\mu_X\mu_Y$
- Własności kowariancji
- $\sigma_{X,Y} = \sigma_{Y,X}$
- $\sigma_{X,k} = 0$
- $\sigma_{kX,Y} = k\sigma_{X,Y}$
- $\sigma_{X,Y+Z} = \sigma_{X,Y} + \sigma_{X,Z}$
Współczynnik korelacji liniowej Pearsona
- Korelacja zmiennych losowych
- Estymator współczynnika korelacji
Przykład c.d.:
$S_X$ = 1
$S_Y$ = 2.646
$r = \frac{-2}{1*2.646} = -0.76$
In [5]:
interact(corr_plot, slope=(-1, 1, 0.1), sd=(0,10,1), typ=["kowariancja", "korelacja"])
Out[5]:
In [6]:
interact(corr_examples, typ=["kowariancja", "korelacja"], example=["1", "2"])
Out[6]:
Test na istotność współczynnika korelacji
- Układ hipotez:
$\;\;\;\;\;\;H_0: \rho=0$
$\;\;\;\;\;\;H_1: \rho > / \neq / < 0$
- Statystyka: $$t=\frac{r}{\sqrt{1-r^2}}\sqrt{n-2}~\sim~t(n-2)$$
Prosta regresja liniowa
In [7]:
interact(corr_plot, slope=(-1, 1, 0.1), sd=(0,10,1), typ=["kowariancja", "korelacja"])
Out[7]:
$Y = \hat{Y} + \epsilon$
$Y=\beta_0+\beta_1X+\epsilon$
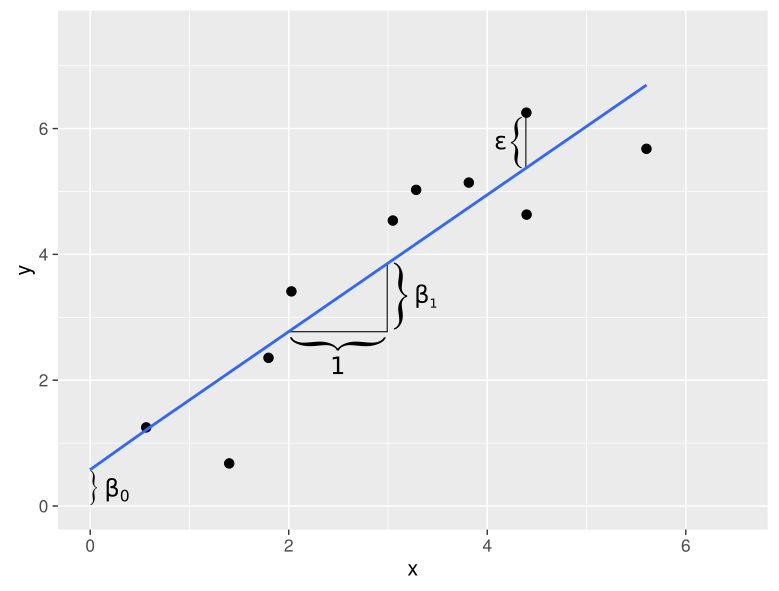
Założenia:
- Zależność liniowa między X i Y
- Wartości zmiennej niezależnej X są ustalone
- $\epsilon \sim N(0,\sigma^2)$
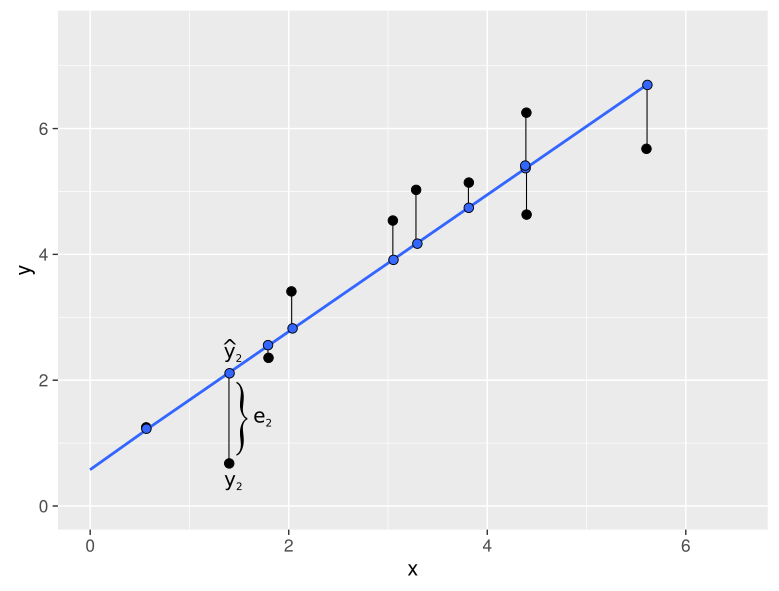
Metoda najmniejszych kwadratów
$Y=b_0+b_1X+e$
$\hat{Y}=b_0+b_1X$
$e_i=y_i-\hat{y_i}$
- Suma kwadratów rezyduów
- Wyraz wolny
- Współczynnik kierunkowy
prosta regresji przechodzi przez $(\bar{x}, \bar{y})$
znak($b_1$) = znak($r$)
Przykład c.d. 2:
b1 = -2/1 = -2
b0 = 4 + 4 = 8
In [8]:
x = np.array([1,2,3])
y = np.array([5,6,1])
plt.scatter(x, y)
a = -2
b = 8
plt.plot(x, x*a+b)
Out[8]:
Kwartet Anscombe’a
